by Timothy McQuiston, Vermont Business Magazine The Emergency Board met Tuesday to hear and accept the tax revenue projections presented by Jeff Carr of Economic & Police Resources of Williston and Tom Kavet, Kavet, Rockler & Associates, LLC of Townshend. Revenues are expected to continue their blistering pace, which includes impressive returns for the personal income tax, benefits from changes in some sources and the recent and likely short-lived windfall from the interest income, which in this report is the fourth largest revenue source.
Of the interest income, Carr said, “I hope you saved this for posterity because I never imagined myself saying that net interest is the 4th largest source of revenue to the General Fund. Two years ago it was two and a half million and the year before it was 0.9 million dollars.”
The interest income is extraordinary because of both high interest rates and over $2 billion sitting in the state treasury. The money is federal post-COVID stimulus and infrastructure funds that are earmarked but not yet spent.
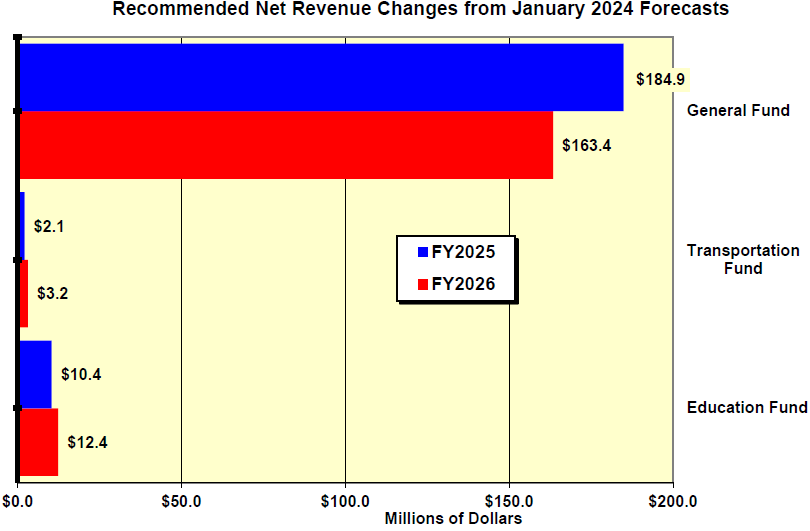
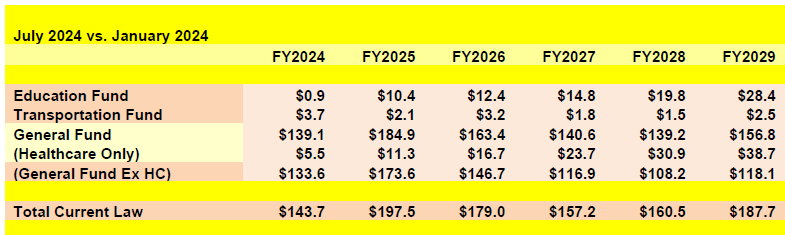
The economics told the E-Board that their consensus revenue report includes $50 million in new revenues from tax and fee changes will increase revenue expectations across all three funds by about $198 million in FY25 and $179 million in FY26 relative to the prior January forecasts.
The E-Board is comprised of the chairs of the four legislative money committees and Governor Phil Scott.

The Emergency Board meets in the Governor's Ceremonial Office at the State House July 30, 2024. at the far right, Jeff Carr, foreground, and Tom Kavet presented their consensus revenue report. Screen shot.
Overview. Tom Kavet, Kavet, Rockler & Associates, LLC
Despite stiffening headwinds as real interest rates (the nominal interest rate minus the rate of inflation) rise, the economy has been extraordinarily resilient. Labor markets remain solid, with unemployment still only about 4% and average job growth topping 200,000 per month in the last year, while real GDP in the second quarter of this year posted 2.8% growth, outperforming almost all expectations.
Meanwhile, inflation has been declining and though not fast enough for the Fed to ease rates yet, it looks increasingly likely that at their September meeting a 25 basis point cut may be in the cards. The sturdy economy kept all three major funds in the black through the end of FY24 (with the G-Fund up 6.5%, the T-Fund up 1.2% and the E-Fund up a mere 0.1% above January targets) and reinforces the likelihood that some of this strength will continue in FY25 and beyond.
This, and about $50M in new revenues from tax and fee changes will increase revenue expectations across all three funds by about $198M in FY25 and $179M in FY26 relative to the prior January forecasts, per the above chart.
Economic, Fiscal and Monetary Policy Update
• Inflation remains front and center to the economic outlook due to the myriad ways it affects the economy: prices, consumption, tax revenues, general consumer sentiment, pivotal Federal Reserve Board interest rate decisions, trade flows, political decisions by the electorate and distributional issues between various economic players with and without pricing power as they struggle to determine the incidence of price changes – the “winners and losers” as prices rise (or fall).
• Overall consumer prices have risen 21.0% since pre-pandemic prices as of December 2019, with wide variation across consumer items and at different periods over the past four years. The biggest increases have been in consumer essentials such as grocery items and energy products. Despite the fact that average weekly earnings have increased 26.1% over the same period, there is enormous variation in the distributional effects of these earnings and price swings, and the earnings gains came earlier than the price increases, leading to widespread current discontent. Over the past year, earnings have exceeded CPI inflation every month, but real earnings growth has been tepid, at best. • In the past 12 months, the CPI has bounced between 3.0% and 3.7%, while the PCE Price Index, which is the Fed’s preferred price measure, has averaged about 2.6%. Although this is still above the 2% target rate, there are many technical caveats to the current inflation metrics and also concerns over the lagged effects of high rates on future labor markets and economic growth. This has prompted many to believe that the Fed will consider recent and directional inflation “close enough” and, mindful of its dual mandate for full employment and stable low inflation, will begin to ease rates beginning in September, dropping them by about 25 basis points per quarter throughout FY25 and into FY26.
• This is a critical forecast assumption because holding rates too high for too long is the primary downside risk to this outlook, and is the cause of many historical recessions. The lagged effects of the current high rates will also slow the economy in both FY25 and FY26, limiting revenue growth to rates at or below inflation for most major funds, excluding new tax and fee increases.
• Labor markets have remained remarkably resilient, with new job growth still humming, robust labor force growth via immigration and unemployment rates subdued. While unemployment remains relatively low, there is some concern over the gradual increase in the U.S. rate from a low of 3.4% in April of 2023 to 4.1% in June of 2024. This, however, is an expected outcome of the intentional actions by the Fed to reduce inflationary pressure by slowing the economy. It has led to a delicate balancing act, however, of slowing enough to reduce inflation, but not so much as to initiate a broader self-reinforcing economic decline.
• A gradual softening in labor markets can also be seen in the narrowing of the gap between job openings and the number of unemployed workers, both at the U.S. and Vermont State levels. However, the number of job openings still exceeds the number unemployed for both. The U.S. and Vermont quit rates have also declined in recent months, but are still above “normal” rates.
• Vermont’s unemployment rate is consistently among the lowest in the nation and was tied with North Dakota at 2.1% with the second lowest rate, slightly behind South Dakota at 2.0%. Although Vermont’s rate is up from its lowest level on record (going back to at least 1969) in April and May of 2023, at 1.7%, its current level matches its pre-pandemic rate in February of 2020. Vermont has had the lowest unemployment rate in New England for the past 17 months.
• Continued strong labor markets, average earnings growth above rates of inflation, and retained savings among higher income groups have supported sustained consumer spending growth. Real personal expenditure growth in both May and June was steady at about 2.6%, a solid showing in the face of high interest rates. The toll from high interest rates and distributional disparities in income are, however, evident in rising credit card and auto loan default rates. As of the first quarter of 2024, credit card balances more than 30 days overdue rose to a 12 year high of 8.93%, more than double the rate in the fourth quarter of 2021, when the effective federal funds interest rate was less than 1%. Rates among those in the poorest 10% of zip codes rose from a recent low of 14.9% to more than 21% in the latest quarter. At an average interest rate of 20.66%, there is an acceleration in the period of time credit card debt can become unsustainable.
• Residential real estate prices continue to confound expectations of a steep slowing or decline to date. Through the first quarter of 2024 (the latest available data), home prices in Vermont rose 10.1%, the third highest in the nation, and the other five New England states were all among the top twelve states in price growth. After five to ten states posted small year over year price declines in the past three quarters, all 51 states showed price growth in the most recent quarter. The states that have shown any declines in the last year are mostly western states that experienced explosive price appreciation in the past ten-year real estate cycle upswing.
• It is important to note that despite the absence of new federal fiscal stimulus, there is a huge pipeline of unspent and unallocated federal largess parked in state bank accounts and not yet spent that will be powering economic activity throughout the nation. Vermont’s $2+ billion cash balance is loosely consistent with a total U.S. state cash reserve of more than $1 trillion. As this is spent down – and much of it is required to be spent or dedicated by FY26 – it will act as a massive offset to the Fed’s efforts to slow the economy and contain inflation at a 2% rate.
• A slowing economy, such as that expected in FY25 and FY26, is far more vulnerable to external shocks such as geo-political conflicts, financial market duress, Fed policy mistakes, and internal disunity, violence and election year extremism.
• On the other hand, the U.S. is in an enviable global economic position, with lower inflation, higher growth, strong innovation and entrepreneurial activity, a labor force of whatever size we want and need, dominant capital markets, top higher educational institutions, great wealth and a reserve currency that has been globalized to our considerable advantage. The same forces that propelled the economy through high interest rates and other economic headwinds in FY24, along with another dose of good luck, are also capable of generating upside to this forecast in FY25 and beyond.
State Revenue Update
• Most revenue categories closed FY24 very close to expectations, with two notable exceptions: Personal Income and Interest income. These two categories accounted for about 90% of the overage in the General Fund (including Healthcare and 93% if it is excluded) and account for most of the forecast adjustment not associated with tax and fee changes.
• Mixed into the revenue estimates in this update are some of the largest tax and fee increases in recent sessions, totaling about $44M in FY25 and $52M in FY26, across all three major funds. In addition to these, there is a new Childcare payroll tax that will add close to $100M per year that is carried below the line on Tables 1 and 1A (below the General Fund tables) but not included in any major existing fund. Over the entire five-year forecast period, these taxes and fees are expected to generate nearly $800M in new revenue.
• The new Childcare payroll tax is expected to yield about $93M in FY25 (with only half a year of self-employment tax payments in April) and grow to about $100M in FY26 and FY27, but because most of it will be collected and initially comingled with the Personal Income Withholding tax, it will make monthly revenue tracking challenging until there are sufficient data with which to estimate its monthly, quarterly and annual allocations out of the General Fund. We will be working closely with the Tax Department to coordinate and estimate these adjustments to the regular revenue data reported, but there will likely be some General Fund revenue month-to-month uncertainty in FY25.
• FY24 Personal Income receipts had been expected to decline with an economy stalling in the face of high interest rates, but instead grew 2.7%, yielding an additional $102M in revenues. Although it is too early to fully dissect tax year 2023 returns (until final October filings are made), it is clear from detailed Tax Department data available to date, that income distributions continued to tilt towards higher income taxpayers, who pay a higher marginal tax rate, thereby raising the overall effective tax rate and revenue yields. In tax year 2022, the effective tax rate was 3.69%, the highest rate on record (to 1976), with the exception of tax year 2021 at 3.89%. Taxpayers earning more than $200K paid more than 35% of all Vermont taxes in both tax years 2021 and 2022, significantly above tax year 2020 (at 30%) and accounted for more than 55% of all adjusted gross income received in the State in both years. Tax year 2023 is likely to be comparable to these two years. This growing reliance on higher income taxpayers has generated solid revenue growth, but it is much more volatile and vulnerable to decline during recessionary periods than broader-based taxes.
• Rising asset prices are also likely to have been a contributing factor in recent PI revenue strength. Both real estate and equity markets have experienced extraordinary value growth, leading to large potential capital gains liabilities in both current and future years.
• Meals and Rooms revenues closed FY24 2.8% above target, yielding about $4.7M in additional revenue. Despite unfavorable weather through much of the early ski season, late snows and the solar eclipse generated healthy room occupancy and visitation for the season – which was only down slightly from the prior year. Climate change, however, is likely to generate increasingly erratic weather patterns, challenging the State’s ski industry. Average winter ski area visitation in Vermont over the last 9 years is 10% lower than the previous 9-year period and the Northeast’s share of the total ski market has declined from 23.1% to 20.9% over this same time span.
• A new 3% surcharge on short term rentals like Airbnb, Homeaway/Vrbo, Vacasa, Evolve, etc., is expected to yield about $8.6 million in FY25 revenue and full-year revenue of $10.7M in FY26. This component of the Vermont rooms tax currently accounts for more than a third of all Rooms revenue, but after growing exponentially in its first few years (especially during the pandemic) has matured and posted subdued growth in FY24. 100% of the revenue from this surcharge will be allocated to the Education Fund, rather than the usual 25% of Source Meals and Rooms.
• Sales and Use tax revenues ended FY24 almost spot on expectations (-0.2%), but will be reduced in FY25 and beyond by the statutory loss of cannabis sales tax revenues to a separate fund, estimated to reduce the Available Education Fund by about $10M per year. It will benefit, however, from another new tax that is a part of Act 183 that taxes “prewritten software accessed remotely” (aka the Cloud tax), that will generate about $10.3M in FY25 and nearly $14M in FY26, ultimately resulting in new revenue of more than $30M by FY29. Like many new taxes, estimates of the yield on this tax are highly uncertain, and administration of the tax may be complex if definitionally challenged. Unfortunately, it will not be easy to measure actual revenues from this tax, since it will not be separately tracked by the Tax Department.
• Property Transfer Tax revenues closed FY24 slightly above targets, dropping only about 10% below FY23 levels instead of the forecast 13% decline. Sustained high interest rates will further reduce FY25 property transfer volumes, but a large tax rate change in Act 181 is expected to generate as much as $15.4M in additional FY25 Source General Fund revenue and turn what would otherwise be about a 6% decline into a 20% gain. In FY26, the full year impact of the rate change will add $17.2M to Source funds and schedules a change in the formula allocating Source to Available General Fund revenue that will result in a 16.8% gain in Available GFund PTT revenues in a year that would otherwise show little if any growth. This rate increase will expand the Property Transfer tax by about almost 30% when it is fully implemented. It should be noted that there is heightened uncertainty associated with yields from large tax increases such as this due to unforeseeable elasticity responses.
• Revenues from General Fund Fees were close to expectations in FY24 (+0.5% above target) and would otherwise expect to see only modest growth in FY25 were it not for Act 113, which will add about $9M per year to this revenue category over the entire forecast horizon.
• Interest income from the vast cash balances associated with banked Federal stimulus and infrastructure programs closed FY24 at a record $93M, more than $20M above January forecasts. As a revenue category that generated a mere $2.6M only two years ago and $0.9M in the year before that, there was little historical data upon which to develop credible statistical forecasting models. The absence of historical monthly flows of revenue that were anywhere close to current patterns also made it difficult to track during the year and adjust estimates. The forecast miss was due to both higher cash balances than expected and higher interest rates. The current forecast assumes both a drawdown of the cash balances as required by federal law, and declining interest rates over the next five years, which will reduce Source revenues from their current peak in FY24 to about $70M in FY25 and $50M in FY26, before receding to about $30M in FY27-FY29. Despite better source data than we had in January, there is still a great deal of uncertainty in these estimates due to variability in effective investment yields and timing, unrestricted cash balance levels, Fed interest rate moves, and erratic allocations to various funds (which left General Fund Interest income well above target and Education Fund Interest well below target in FY24).
• The Transportation Fund edged above FY24 projections by 1.2% following a January downgrade that may have been based on December data reporting anomalies associated with the adoption of a new computer system. It seems that most of the FY24 fee increases were realized as expected, so assuming the full year impacts are similarly accurate, FY25 should see about a 5% bump in revenue before returning to annual growth rates under 2%. Aside from the fee increases, the strongest source of future Transportation Fund growth is expected to be Motor Vehicle Purchase and Use tax revenues, which will benefit from lower interest rates and expanding inventories by mid-FY25 and beyond.
• Cigarette and Tobacco Products revenue in the Healthcare Fund finished FY24 3.2% below target (-$2.3M), as e-cigarette revenue declined for the first time in its short history. Multiple lawsuits and other government action against e-cig industry leader JUUL and fierce competition from a new synthetic nicotine delivery product, nicotine-infused pouches that can be invisibly placed between cheek and gum, were the likely causes. Inquires to the Tax Department reveal some confusion as to how nicotine pouches are taxed in Vermont that would benefit from statutory clarification. Although at least one Vermont distributor said they paid tobacco products tax on sales of the dominant brand, Phillip Morris’ “ZYN,” it is unknown if any others have followed suit. These pouches are of particular threat to school-aged children, since there is no vapor, smoke or other visible sign of their use in a classroom setting. Phillip Morris boasted in a Wall Street Journal article six days ago that surging demand for ZYN led to shipment growth of more than 50% in the second quarter and created supply shortages. With overall revenues that beat analyst estimates by $300M in the quarter, they announced plans to build a second ZYN production plant. With the formidable marketing power of big tobacco behind these products, without statutory intervention, they are likely to cannibalize other tobacco products, accelerating expected revenue declines in Cigarettes and other Tobacco Products. Relative to January revenue projections, the Healthcare Fund could lose $5M-$6M per year in FY25 and FY26, with mounting losses throughout the five year forecast horizon.
• The U.S. and Vermont macroeconomic forecasts upon which the revenue forecasts in this update are based are summarized in Tables A and B on the following two pages, and represent a consensus JFO and Administration forecast developed using internal JFO and Administration State economic models with input from Moody’s Analytics June 2024 projections and other major forecasting entities, including the Federal Reserve, EIA, CBO, IMF, The Conference Board and other private forecasting firms with whom we interact.