Vermont Business Magazine Average gasoline prices in Vermont are $3.20 per gallon, up 4 cents per gallon from last week. They're down 7 cents/g from last month and down 32 cents/g from the same time a year ago. The lowest price in the state yesterday was $2.94/g in Rutland while the highest was $3.49/g in Londonderry and Wilmington. After edging lower for several months, gasoline prices here and across the nation are expected to head back up well into the spring.
Average gasoline prices in Burlington have fallen 2.6 cents per gallon in the last week, averaging $3.17/g today, according to GasBuddy's survey of 100 stations in Burlington. Prices in Burlington are 16.0 cents per gallon lower than a month ago and stand 39.5 cents per gallon lower than a year ago.
According to GasBuddy price reports, the cheapest station in Burlington was priced at $2.94/g yesterday while the most expensive was $3.29/g, a difference of 35.0 cents per gallon.
The national average price of gasoline has risen 6 cents per gallon in the last week, averaging $3.15/g today. The national average is up 9 cents per gallon from a month ago and stands 34 cents per gallon lower than a year ago, according to GasBuddy data compiled from more than 11 million weekly price reports covering over 150,000 gas stations across the country.
The national average price of diesel has fallen 0.5 cents in the last week and stands at $3.87 per gallon.
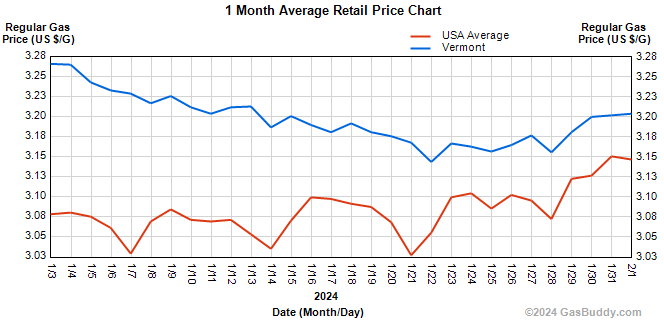
| Vermont | USA | Trend | |
|---|---|---|---|
| Today | 3.209 | 3.152 |  |
| Yesterday | 3.207 | 3.156 | |
| One Week Ago | 3.162 | 3.091 | |
| One Month Ago | 3.277 | 3.063 | |
| One Year Ago | 3.522 | 3.490 | |
| * Average Regular Gas Prices - Updated: 9:55 AM | |||
Historical gasoline prices in Burlington and the national average going back ten years:
January 29, 2023: $3.57/g (U.S. Average: $3.49/g)
January 29, 2022: $3.46/g (U.S. Average: $3.36/g)
January 29, 2021: $2.42/g (U.S. Average: $2.42/g)
January 29, 2020: $2.70/g (U.S. Average: $2.48/g)
January 29, 2019: $2.48/g (U.S. Average: $2.27/g)
January 29, 2018: $2.67/g (U.S. Average: $2.58/g)
January 29, 2017: $2.35/g (U.S. Average: $2.26/g)
January 29, 2016: $2.03/g (U.S. Average: $1.81/g)
January 29, 2015: $2.39/g (U.S. Average: $2.04/g)
January 29, 2014: $3.43/g (U.S. Average: $3.27/g)
Neighboring areas and their current gas prices:
Albany- $3.18/g, up 1.8 cents per gallon from last week's $3.17/g.
New Hampshire- $3.02/g, up 1.8 cents per gallon from last week's $3.01/g.
"We've seen the national average price of gasoline bounce back up after cold weather-related refinery shutdowns pushed up the wholesale price of gasoline. Plus, recent GDP data and new attacks in the Red Sea have pushed oil prices to their highest level since November," said Patrick De Haan, head of petroleum analysis at GasBuddy. "While prices have inched up and may continue to slowly rise, I believe the larger increases will be witnessed in a few weeks as we enter mid-February, lasting through April or May, during which the national average could rise 35 to 85 cents per gallon. Other issues and tensions could complicate how quickly prices rise or how high they go, so while the rise is not completely charted, it could deviate from our expectations."
GasBuddy is the authoritative voice for gas prices and the only source for station-level data. GasBuddy's survey updates 288 times every day from the most diverse list of sources covering nearly 150,000 stations nationwide, the most comprehensive and up-to-date in the country. GasBuddy data is accessible at http://prices.GasBuddy.com.
SOURCE 1.29.2024. GasBuddy