by Timothy McQuiston, Vermont Business Magazine Today, the Vermont Department of Labor reported that the seasonally adjusted statewide unemployment rate for March was 2.2 percent. This reflects a decrease of one-tenth of one percentage point from the prior month’s revised estimate. The civilian labor force participation rate was 65.4 percent in March, an increase of one-tenth of one percentage point from the prior month’s revised estimate.
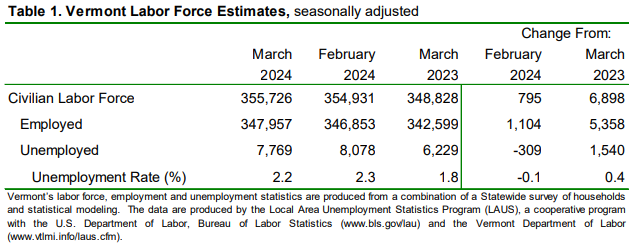
All three major metrics showed improvement. The Vermont civilian labor force increased by 795 from the prior month’s revised estimate (see Table 1). The number of employed persons increased by 1,104 and the number of unemployed persons decreased by 309.
Changes to the number of employed, the number of unemployed and the unemployment rate were statistically significant in the seasonally adjusted series.
Vermont has the third lowest rate in the nation, just below North (2.0) and South (2.1) Dakota. California has the highest rate at 5.3 percent.
The comparable United States rate in March was 3.8 percent, a decrease of one-tenth of one percentage point from the revised February estimate.
Labor Commissioner Michael Harrington said: “Today the Department is releasing preliminary statewide estimates for March 2024 as well as revised historical data for the sub-state regions within Vermont. The updated data shows that the Burlington-South Burlington labor market area had the lowest unemployment rate (1.6%) while the Derby labor market had the highest unemployment rate (3.6%) in 2023. Regional data is critical to local planning and economic development efforts. Post the 2020 Census, the federal government has decided to move away from town defined labor market areas. As a result, starting in mid-2024, there will be changes to the availability of sub-state data in Vermont. This process is on-going and not yet complete. We are starting to notify data users of this upcoming change. If you have questions about the pending changes to sub-state data or want to talk more about labor data in Vermont, please call 802-828-4157 or email [email protected] to communicate directly with a labor market information specialist.”
The seasonally adjusted Vermont data for March show the Vermont civilian labor force increased by 795 from the prior month’s revised estimate (see Table 1). The number of employed persons increased by 1,104 and the number of unemployed persons decreased by 309.
Changes to the number of employed, the number of unemployed and the unemployment rate were statistically significant in the seasonally adjusted series.
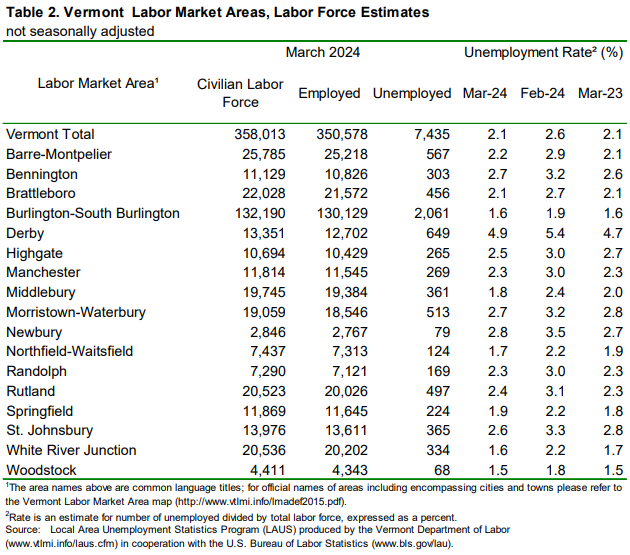
The March unemployment rates for Vermont’s 17 labor market areas ranged from 1.5 percent in Woodstock to 4.9 percent in Derby (note: local labor market area unemployment rates are not seasonally-adjusted – see Table 2). For comparison, the March unadjusted unemployment rate for Vermont was 2.1 percent, a decrease of five-tenths of one percentage point from the revised unadjusted February level and no change from a year ago.
Meanwhile, weekly unemployment claims are largely unchanged and remain at a slightly elevated level as the ski season winds down. For the week of April 13, new UI claims were 429, up 6 over the previous week and up 70 from the same time last year.
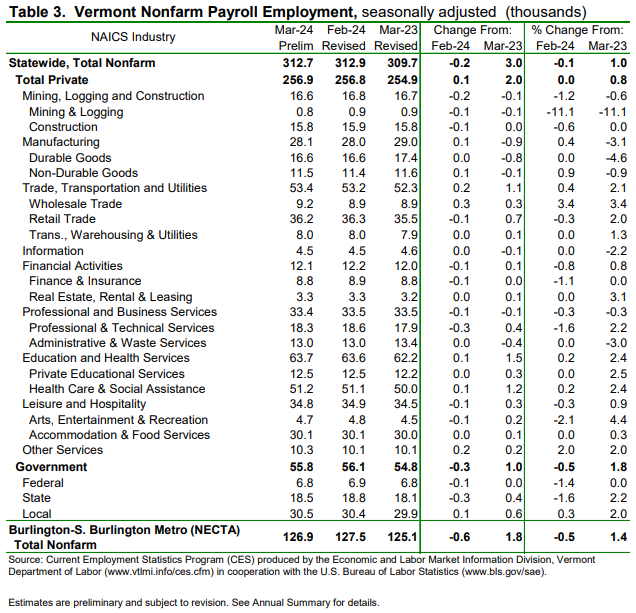
Seasonally Adjusted (Table 3)
The seasonally adjusted data for March reported a decrease of 200 jobs from the revised February data. There was an increase of 200 jobs between the preliminary and the revised February estimates due to the inclusion of more data.
The seasonally adjusted over-the-month changes in March varied at the industry level. Industries with a notable increase included: Wholesale Trade (+300 jobs or +3.4%), and Other Services (+200 jobs or +2.0%). Industries with a notable decrease included: Professional & Technical Services (-300 jobs or -1.6%) and State Government (-300 jobs or -1.6%).
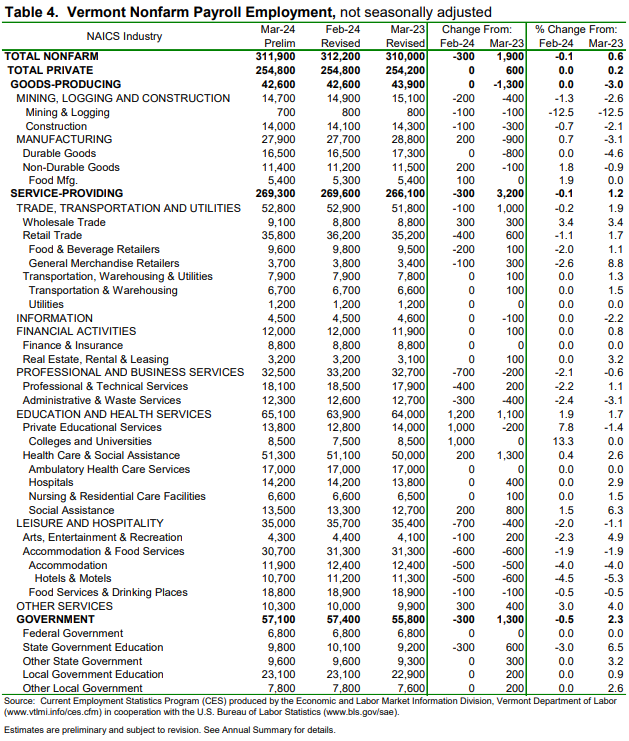
Not-Seasonally-Adjusted (Table 4)
The preliminary ‘not-seasonally-adjusted’ jobs estimates for March showed a decrease of 300 jobs when compared to the revised February numbers. As with the seasonally adjusted data, this over-the-month change is from the revised February numbers which experienced an increase of 100 jobs from the preliminary estimates.
The broader economic picture can be seen by focusing on the over-the-year changes in this data series. As detailed in the preliminary not-seasonally[1]adjusted March data, Total Private industries increased by 600 jobs (+0.2%) over the year and Government (including public education) employment increased by 1,300 jobs (+2.3%) in the past year.
The Unemployment and Jobs Report for April is scheduled to be released on Friday, May 17, 2024, at 10:00 a.m
| State | March 2024(P) rate |
Rank |
|---|---|---|
|
North Dakota |
2.0 | 1 |
|
South Dakota |
2.1 | 2 |
|
Vermont |
2.2 | 3 |
|
Maryland |
2.5 | 4 |
|
Nebraska |
2.5 | 4 |
|
New Hampshire |
2.6 | 6 |
|
Kansas |
2.7 | 7 |
|
Minnesota |
2.7 | 7 |
|
Utah |
2.8 | 9 |
|
Wyoming |
2.8 | 9 |
|
Iowa |
2.9 | 11 |
|
Massachusetts |
2.9 | 11 |
|
Virginia |
2.9 | 11 |
|
Alabama |
3.0 | 14 |
|
Mississippi |
3.0 | 14 |
|
Wisconsin |
3.0 | 14 |
|
Georgia |
3.1 | 17 |
|
Hawaii |
3.1 | 17 |
|
South Carolina |
3.1 | 17 |
|
Florida |
3.2 | 20 |
|
Tennessee |
3.2 | 20 |
|
Idaho |
3.3 | 22 |
|
Maine |
3.3 | 22 |
|
Missouri |
3.3 | 22 |
|
Montana |
3.3 | 22 |
|
Pennsylvania |
3.4 | 26 |
|
Arkansas |
3.5 | 27 |
|
Indiana |
3.5 | 27 |
|
North Carolina |
3.5 | 27 |
|
Oklahoma |
3.5 | 27 |
|
Colorado |
3.7 | 31 |
|
Arizona |
3.8 | 32 |
|
New Mexico |
3.8 | 32 |
|
Ohio |
3.8 | 32 |
|
Delaware |
3.9 | 35 |
|
Michigan |
3.9 | 35 |
|
Texas |
3.9 | 35 |
|
Rhode Island |
4.0 | 38 |
|
Oregon |
4.2 | 39 |
|
New York |
4.3 | 40 |
|
West Virginia |
4.3 | 40 |
|
Louisiana |
4.4 | 42 |
|
Connecticut |
4.5 | 43 |
|
Kentucky |
4.5 | 43 |
|
Alaska |
4.6 | 45 |
|
Illinois |
4.8 | 46 |
|
New Jersey |
4.8 | 46 |
|
Washington |
4.8 | 46 |
|
Nevada |
5.1 | 49 |
|
District of Columbia |
5.2 | 50 |
|
California |
5.3 | 51 |
|
Footnotes |
||
|
Note: Rates shown are a percentage of the labor force. Data refer to place of residence. Estimates for the current month are subject to revision the following month. |
||
