by Timothy McQuiston, Vermont Business Magazine Today, the Vermont Department of Labor released the seasonally adjusted statewide unemployment rate for August as 1.8 percent. This reflects no change from the prior month’s revised estimate, which is the lowest on record for the state. Vermont is tied with New Hampshire for the second lowest rate in the nation; Maryland is lowest at 1.7 percent and Nevada is highest at 5.4 percent.
The comparable United States rate in August was 3.8 percent, an increase of three-tenths of one percentage point from the revised July estimate.
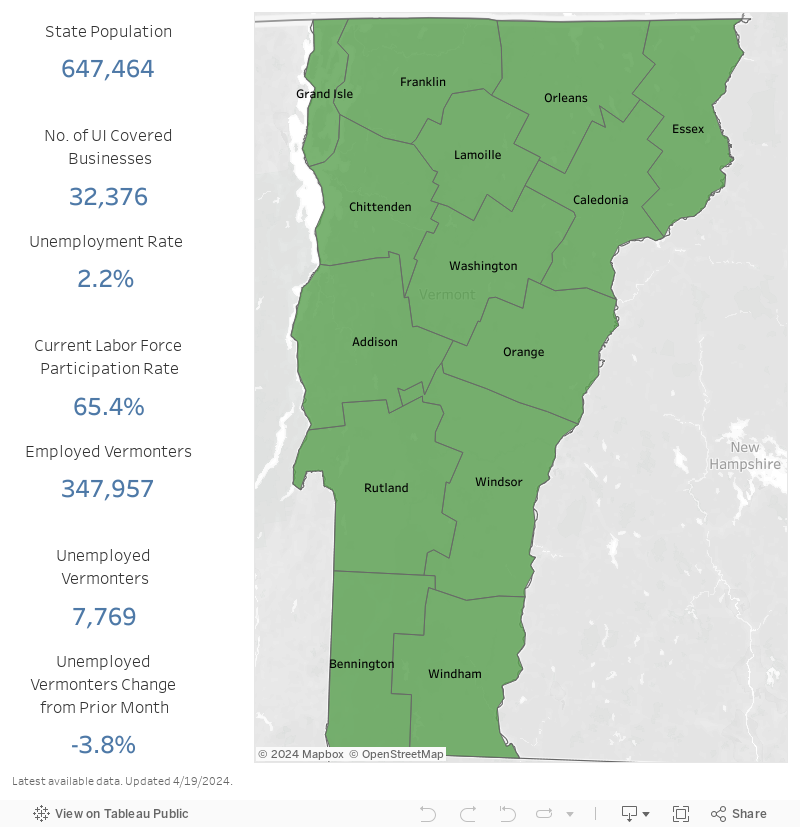
The seasonally adjusted Vermont data for August show the Vermont civilian labor force increased by 771 from the prior month’s revised estimate (see Table 1). The number of employed persons increased by 670 and the number of unemployed persons increased by 101. No changes were statistically significant in the seasonally adjusted series.
The civilian labor force participation rate was 64.0 percent in August, an increase of one-tenth of one percentage point from the prior month’s revised estimate.
Weekly unemployment claims, which had spiked after the July floods, have fallen back to a low level. For the week of September 9, initial unemployment insurance claims were 152, down 59 from last week and down 54 from the same time last year.
Meanwhile, The typical Vermont family saw modest income growth last year, but it was not enough to keep up with inflation. According to new data from the U.S. Census, Vermont median household income1 rose to $73,991 in 2022. That was a 2.2 percent increase from 2021, the second smallest increase in the country. Only New Hampshire had a smaller increase. The picture looks a little bleaker when inflation is taken into account. Vermont median household income actually fell last year, by 5.5 percent, after adjusting for inflation.
See all tables below.
Vermont median household income takes a hit
Michael Harrington, Commissioner of the Vermont Department of Labor, said: “The economic data released today is beginning to show some consistency following the July floods. The jobs data captures information on filled positions as reported by Vermont employers. With nearly twenty-thousand open jobs in the state, the Department is ready to support employment matches through active engagement with both jobseekers and employers. These relationships contribute to a vibrant 2023 Fall Job Fest which is currently underway. Two successful events were held last week with four more events already scheduled – including one this week on September 21st in Bennington. Through these in-person hiring events, we aim to empower jobseekers to explore diverse career paths, engage with local employers, and find fulfilling employment opportunities right here in Vermont. All events are free for jobseekers, and all are encouraged to attend. For more information about future job fairs and other resources for individuals interested in career services, contact the Vermont Department of Labor at 802-828-4394 or visit our website www.labor.vermont.gov.”

The August unemployment rates for Vermont’s 17 labor market areas ranged from 1.7 percent in White River Junction to 3.1 percent in Derby (note: local labor market area unemployment rates are not seasonally-adjusted – see Table 2). For comparison, the August unadjusted unemployment rate for Vermont was 2.2 percent, an increase of four-tenths of one percentage point from the revised unadjusted July level and a decrease of six-tenths of one percentage point from a year ago.

Seasonally-Adjusted (Table 3)
The seasonally-adjusted data for August reported a decrease of 300 jobs from the revised July data. There was a decrease of 1,900 jobs between the preliminary and the revised July estimates due to the inclusion of more data. The seasonally-adjusted over-the-month changes in August were varied at the industry level. Those with a notable increase included: State Government (+600 jobs or +3.3%) and Finance & Insurance (+100 jobs or +1.1%). Industries with a notable decrease included: Private Education Services (-400 jobs or -3.3%) and Local Government (-500 jobs or -1.6%)

Not-Seasonally-Adjusted (Table 4)
The preliminary ‘not-seasonally-adjusted’ jobs estimates for August showed a decrease of 900 jobs when compared to the revised July numbers. As with the seasonally-adjusted data, this over-the-month change is from the revised July numbers which experienced an increase of 400 jobs from the preliminary estimates. The broader economic picture can be seen by focusing on the over-the-year changes in this data series. As detailed in the preliminary not-seasonally-adjusted August data, Total Private industries increased by 1,300 jobs (+0.5%) over the year and Government (including public education) employment increased by 2,300 jobs (+4.6%) in the past year.


The Unemployment and Jobs Report for September is scheduled to be released on Friday, October 20th, 2023 at 10:00 a.m.
| State | August 2023(P) rate |
Rank |
|---|---|---|
|
Maryland |
1.7 | 1 |
|
New Hampshire |
1.8 | 2 |
|
Vermont |
1.8 | 2 |
|
North Dakota |
1.9 | 4 |
|
South Dakota |
1.9 | 4 |
|
Nebraska |
2.0 | 6 |
|
Alabama |
2.1 | 7 |
|
Maine |
2.5 | 8 |
|
Montana |
2.5 | 8 |
|
Utah |
2.5 | 8 |
|
Virginia |
2.5 | 8 |
|
Massachusetts |
2.6 | 12 |
|
Arkansas |
2.7 | 13 |
|
Florida |
2.7 | 13 |
|
Kansas |
2.7 | 13 |
|
Rhode Island |
2.7 | 13 |
|
Hawaii |
2.8 | 17 |
|
Missouri |
2.8 | 17 |
|
Oklahoma |
2.8 | 17 |
|
Iowa |
2.9 | 20 |
|
Wisconsin |
2.9 | 20 |
|
Wyoming |
2.9 | 20 |
|
Idaho |
3.0 | 23 |
|
South Carolina |
3.0 | 23 |
|
Colorado |
3.1 | 25 |
|
Minnesota |
3.1 | 25 |
|
Tennessee |
3.1 | 25 |
|
Mississippi |
3.2 | 28 |
|
Georgia |
3.3 | 29 |
|
Louisiana |
3.3 | 29 |
|
North Carolina |
3.3 | 29 |
|
Indiana |
3.4 | 32 |
|
Ohio |
3.4 | 32 |
|
Oregon |
3.4 | 32 |
|
Pennsylvania |
3.5 | 35 |
|
Connecticut |
3.6 | 36 |
|
Washington |
3.6 | 36 |
|
West Virginia |
3.6 | 36 |
|
Michigan |
3.7 | 39 |
|
New Mexico |
3.7 | 39 |
|
Arizona |
3.8 | 41 |
|
Alaska |
3.9 | 42 |
|
New York |
3.9 | 42 |
|
Kentucky |
4.0 | 44 |
|
Delaware |
4.1 | 45 |
|
Illinois |
4.1 | 45 |
|
Texas |
4.1 | 45 |
|
New Jersey |
4.2 | 48 |
|
California |
4.6 | 49 |
|
District of Columbia |
5.0 | 50 |
|
Nevada |
5.4 | 51 |
|
Footnotes |
||
|
Note: Rates shown are a percentage of the labor force. Data refer to place of residence. Estimates for the current month are subject to revision the following month. |
||
Last Modified Date: September 19, 2023