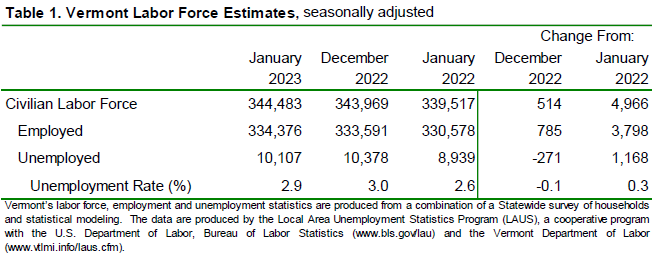
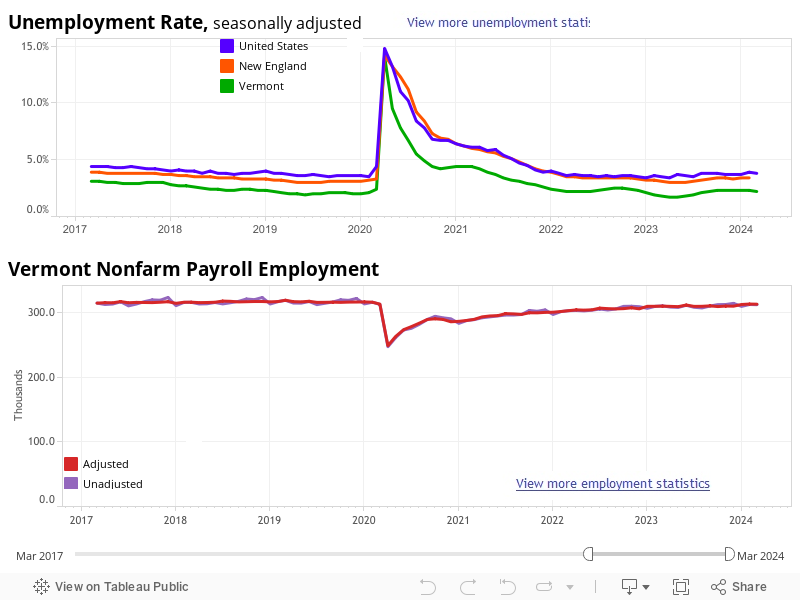
by Timothy McQuiston, Vermont Business Magazine Today, the Vermont Department of Labor reported that the seasonally adjusted statewide unemployment rate for January was 2.9 percent, according to household data. This reflects a decrease of one-tenth of one percentage point from the prior month’s revised estimate. The civilian labor force participation rate was 63.4 percent in January, unchanged from the prior month. The comparable United States rate in January was 3.4 percent, a decrease of one-tenth of one percentage point from the revised December estimate. All three major metrics showed modest improvement as the Labor Force increased, the number of Employed also increased and the number of Unemployed decreased.
The annual adjustments effectively raised the state's unemployment rate, which is now tied for 12th lowest in the nation. For instance, the state's December rate was originally reported as 2.6% (sixth lowest in US) and now adjusted to 3.0% (which would have been tied for 14th). North and South Dakota are lowest at 2.1%. Nevada is highest at 5.5%.
Labor Department Commissioner Michael Harrington said: “As part of this release of the January 2023 data, the Department is also announcing the release of revised historical data for calendar year 2022 and years prior. Overall, calendar year 2022 was stronger than previously reported. Key metrics that were previously underreported have been revised up. These metrics include number of filled Vermont jobs, number of employed persons in Vermont, and the size of Vermont’s labor force.
"In addition, the number of unemployed persons and the unemployment rate were also re-estimated higher; however, even at these new elevated levels, Vermont is still considered to be at full employment. Based on this data, these are still favorable times for jobseekers as the number of available jobs is still two times higher than the number of unemployed individuals. For support with a job search or hiring qualified candidates, jobseekers and businesses are encouraged to visit www.Labor.Vermont.gov/Jobs for information on events and services.”
Meanwhile, weekly unemployment claims increase last week (see tables below). Initial claims in Vermont were up 138 from last week to 574, but down 33 from the same time last year. New and ongoing claims were up 430 to 4,490 for the week, but down 202 for the year.
The Vermont Unemployment Trust Fund stands at a solid $251.8 million, down $1.6 million from last week and up $22 million from last year.
US weekly claims for the week ending March 4 were 211,000, an increase of 21,000 from the previous week's unrevised level of 190,000. This is more than a 10 percent increase and crosses the psychologically "stable" 200,000 threshold; economists were expecting claims to be about 195,000. The 4-week moving average was 197,000, an increase of 4,000 from the previous week's unrevised average of 193,000.
“The labor market continues to show remarkable strength despite the Fed’s efforts to tame inflation and slow the economy by raising interest rates,” said Eric Merlis, managing director, co-head of global markets at Citizens Bank, with branches in Vermont. “The Fed will welcome an uptick in the participation rate. The average hourly earnings are also showing a smaller rate of increase which should remove the urgency for a 50 basis point tightening. We will get the CPI next week and the next Fed rate decision the week after that. All of this data is feeding into the Fed’s efforts to craft a monetary policy that will lower inflation without causing catastrophic job loss.”
The Vermont seasonally-adjusted data for January show the Vermont civilian labor force increased by 514 from the prior month’s revised estimate (see Table 1). The number of employed persons increased by 785 and the number of unemployed persons decreased by 271. None of the changes were statistically significant in the seasonally-adjusted series. The Labor Department releases the January numbers later than usual as it goes through the annual adjustment process.
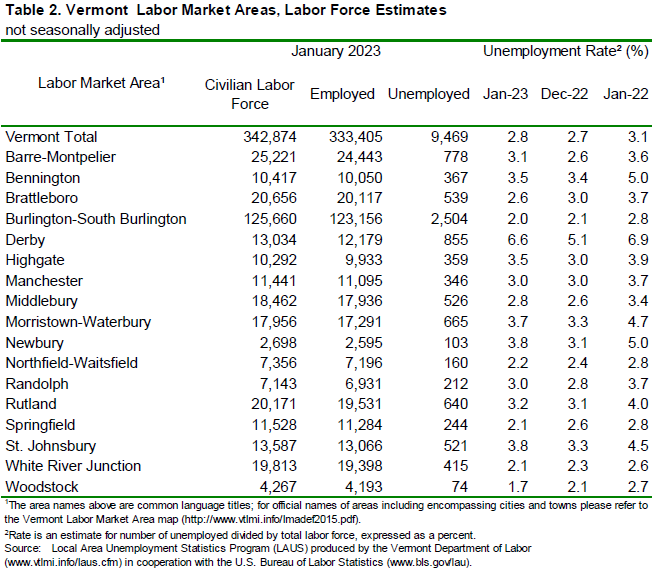
Vermont’s Labor Market Areas
The January unemployment rates for Vermont’s 17 labor market areas ranged from 1.7 percent in Woodstock to 6.6 percent in Derby (note: local labor market area unemployment rates are not seasonally-adjusted – see Table 2). For comparison, the January unadjusted unemployment rate for Vermont was 2.8 percent, an increase of one-tenth of one percentage point from the revised unadjusted December level and a decrease of three-tenths of one percentage point from a year ago.
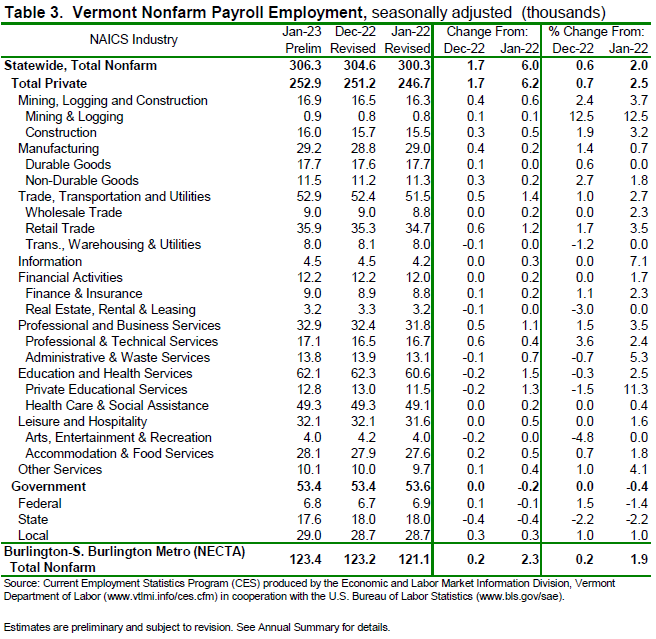
Seasonally-Adjusted (Table 3)
The seasonally-adjusted data for January reported an increase of 1,700 jobs from the revised December data. There was an increase of 2,400 jobs between the preliminary and the revised December estimates due to the inclusion of more data. The seasonally-adjusted over-the-month changes in January were varied at the industry level. Those with a notable increase included: Professional & Technical Services (+600 jobs or +3.6%), Construction (+300 jobs or +1.9%) and Retail Trade (+600 jobs or +1.7%). Industries with a notable decrease included: Arts, Entertainment & Recreation (-200 jobs or -4.8%), State Government (-400 jobs or -2.2%) and Private Educational Services (-200 jobs or -1.5%).
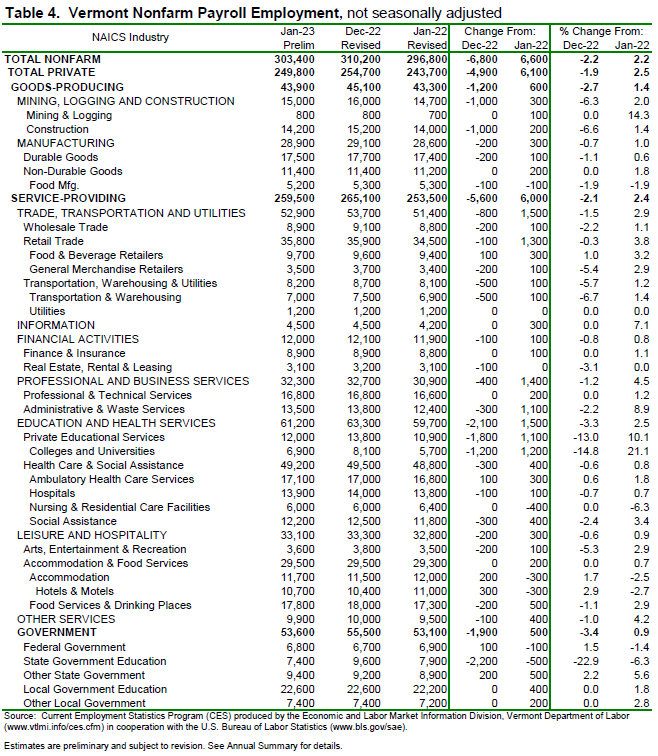
Not-Seasonally-Adjusted (Table 4)
The preliminary ‘not-seasonally-adjusted’ jobs estimates for January showed a decrease of 6,800 jobs when compared to the revised December numbers. As with the ‘seasonally-adjusted’ data, this over-the-month change is from the revised December numbers which experienced an increase of 3,100 jobs from the preliminary estimates. The broader economic picture can be seen by focusing on the over-the-year changes in this data series. As detailed in the preliminary ‘not-seasonally-adjusted’ January data, Total Private industries increased by 6,100 jobs (+2.5%) over the year and Government (including public education) employment increased by 500 jobs (+0.9%) in the past year.


The January press release can also be found at www.vtlmi.info.
The Unemployment and Jobs Report for February is scheduled to be released on Friday, March 24th, 2023 at 10:00 a.m.
| State | January 2023(P) rate |
Rank |
|---|---|---|
|
North Dakota |
2.1 | 1 |
|
South Dakota |
2.1 | 1 |
|
Utah |
2.4 | 3 |
|
Montana |
2.5 | 4 |
|
Nebraska |
2.5 | 4 |
|
Alabama |
2.6 | 6 |
|
Florida |
2.6 | 6 |
|
Idaho |
2.7 | 8 |
|
Missouri |
2.7 | 8 |
|
Colorado |
2.8 | 10 |
|
New Hampshire |
2.8 | 10 |
|
Kansas |
2.9 | 12 |
|
Maine |
2.9 | 12 |
|
Minnesota |
2.9 | 12 |
|
Vermont |
2.9 | 12 |
|
Wisconsin |
2.9 | 12 |
|
Iowa |
3.0 | 17 |
|
Maryland |
3.0 | 17 |
|
Georgia |
3.1 | 19 |
|
Indiana |
3.1 | 19 |
|
Oklahoma |
3.1 | 19 |
|
Rhode Island |
3.1 | 19 |
|
South Carolina |
3.2 | 23 |
|
Virginia |
3.2 | 23 |
|
Arkansas |
3.4 | 25 |
|
New Jersey |
3.4 | 25 |
|
Louisiana |
3.5 | 27 |
|
New Mexico |
3.5 | 27 |
|
Tennessee |
3.5 | 27 |
|
Hawaii |
3.6 | 30 |
|
Massachusetts |
3.6 | 30 |
|
Alaska |
3.8 | 32 |
|
Arizona |
3.8 | 32 |
|
North Carolina |
3.8 | 32 |
|
Connecticut |
3.9 | 35 |
|
Kentucky |
3.9 | 35 |
|
Mississippi |
3.9 | 35 |
|
Texas |
3.9 | 35 |
|
West Virginia |
3.9 | 35 |
|
Wyoming |
3.9 | 35 |
|
Ohio |
4.0 | 41 |
|
California |
4.2 | 42 |
|
New York |
4.2 | 42 |
|
Michigan |
4.3 | 44 |
|
Pennsylvania |
4.3 | 44 |
|
District of Columbia |
4.4 | 46 |
|
Illinois |
4.5 | 47 |
|
Delaware |
4.6 | 48 |
|
Washington |
4.6 | 48 |
|
Oregon |
4.8 | 50 |
|
Nevada |
5.5 | 51 |
|
Footnotes |
||
|
Note: Rates shown are a percentage of the labor force. Data refer to place of residence. Estimates for the current month are subject to revision the following month. |
||
3.13.2023 Vermont Department of Labor www.vtlmi.info