by Timothy McQuiston, Vermont Business Magazine Today, the Vermont Department of Labor reported that the state's the seasonally adjusted unemployment rate decreased by a whopping three-tenths to 2.1% in May. This was not entirely good news as the Labor Force, which is the denominator in this equitation, fell for the first time in many months at a time when the workforce is already facing shortages. However, both the number of employed increased and the number of unemployed decreased in May.
The Vermont civilian labor force participation rate was 63.7 percent in May, unchanged from the prior month.
Vermont was tied with the fourth lowest rate in the nation. New Hampshire was tied for first at 1.9% (a historic low) with Nebraska and South Dakota. Nevada once again had the highest rate at 5.4%.
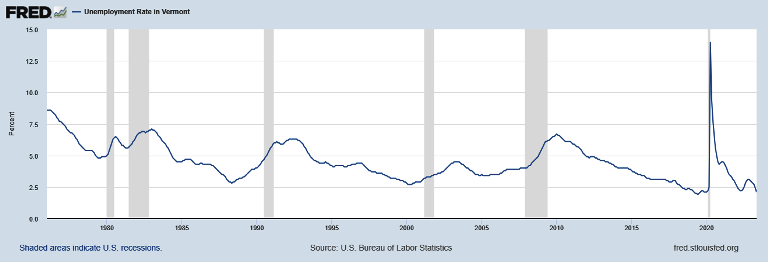
This is the lowest Vermont unemployment rate since January 2020 (2.1%), just two months before the pandemic began. The lowest jobless rate in Vermont was recorded in June 2019 at 1.9 percent. (See data tables below)
The comparable United States rate in May was 3.7 percent, an increase of three-tenths of one percentage point from the revised April estimate.
Labor Commissioner Michael Harrington said of the results: “Every summer, employers across Vermont hire thousands of workers for jobs in Construction, Leisure & Hospitality, and Retail Trade, in addition to many other industries, and while Vermont’s seasonally adjusted monthly employment figures fell in May, there are still more than two job openings for every unemployed Vermonter. Employers are searching for workers in every region of the state and the Department of Labor’s local workforce teams are eager to help match jobseekers with the many opportunities that exist.
"Interested in finding employment or recruiting talented Vermonters? Reach out to one of the Department’s regional job centers today to learn how we can assist. A list of offices and contact information can be found at https://labor.vermont.gov/workforce-development/job-centers.”

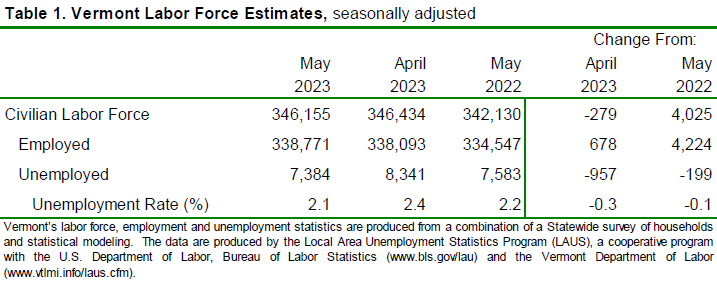
The seasonally adjusted Vermont data for May show the Vermont civilian labor force decreased by 279 from the prior month’s revised estimate (see Table 1). The number of employed persons increased by 678 and the number of unemployed persons decreased by 957. The changes to the unemployment rate and the number of unemployed persons were statistically significant in the seasonally adjusted series.
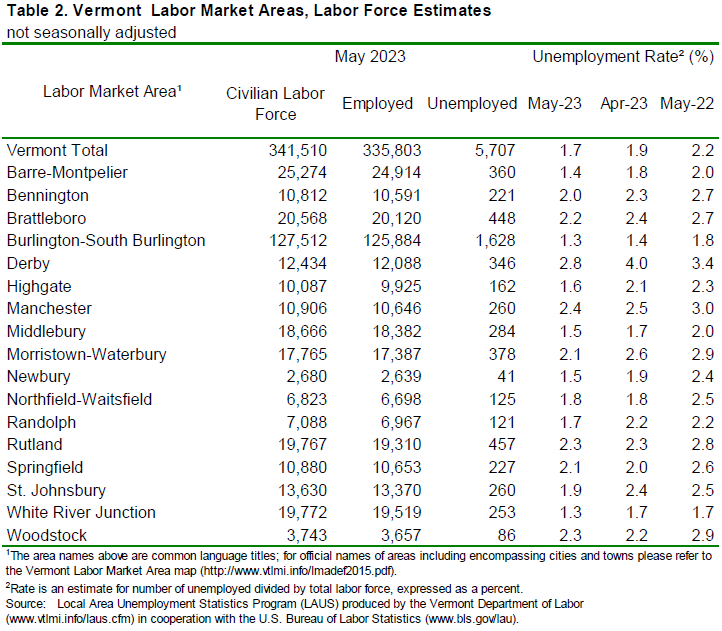
The May unemployment rates for Vermont’s 17 labor market areas ranged from 1.3 percent in Burlington-South Burlington and White River Junction to 2.8 percent in Derby (note: local labor market area unemployment rates are not seasonally-adjusted – see Table 2). For comparison, the May unadjusted unemployment rate for Vermont was 1.7 percent, a decrease of two-tenths of one percentage point from the revised unadjusted April level and a decrease of five-tenths of one percentage point from a year ago.
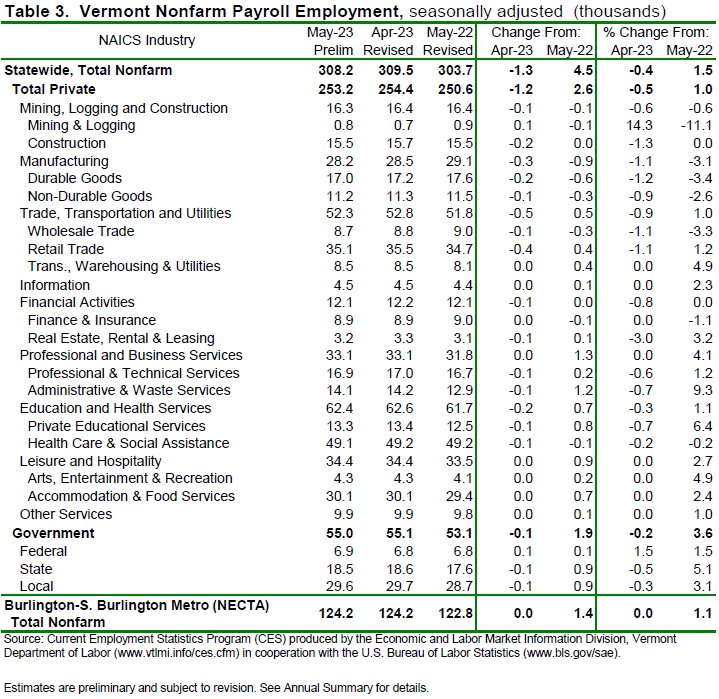
Seasonally-Adjusted (Table 3)
The seasonally-adjusted data for May reported a decrease of 1,300 jobs from the revised April data. There was a decrease of 300 jobs between the preliminary and the revised April estimates due to the inclusion of more data. The seasonally-adjusted over-the-month changes in May were varied at the industry level. Those with a notable increase included: Mining and Logging (+100 jobs or +14.3%) and Federal Government (+100 jobs or +1.5%). Industries with a notable decrease included: Real Estate, Rental and Leasing (-100 jobs or -3.0%), Construction (-200 jobs or -1.3%) and Durable Goods Manufacturing (-200 jobs or -1.2%).
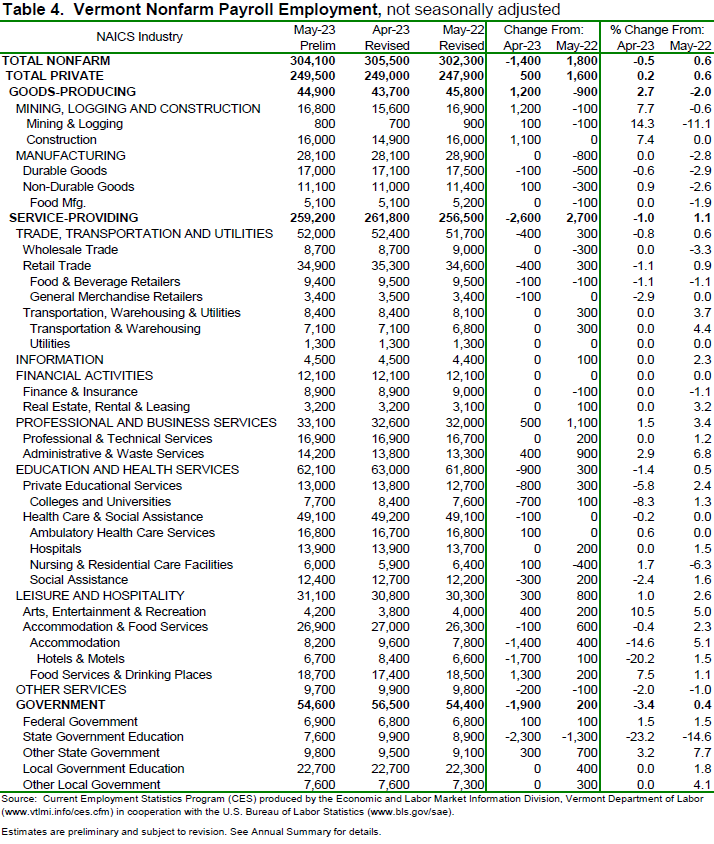
Not-Seasonally-Adjusted (Table 4)
The preliminary ‘not-seasonally-adjusted’ jobs estimates for May showed a decline of 1,400 jobs when compared to the revised April numbers. As with the seasonally-adjusted data, this over-the-month change is from the revised April numbers which experienced an increase of 100 jobs from the preliminary estimates. The broader economic picture can be seen by focusing on the over-the-year changes in this data series. As detailed in the preliminary not-seasonally-adjusted May data, Total Private industries increased by 1,600 jobs (+0.6%) over the year and Government (including public education) employment increased by 200 jobs (+0.4%) in the past year.
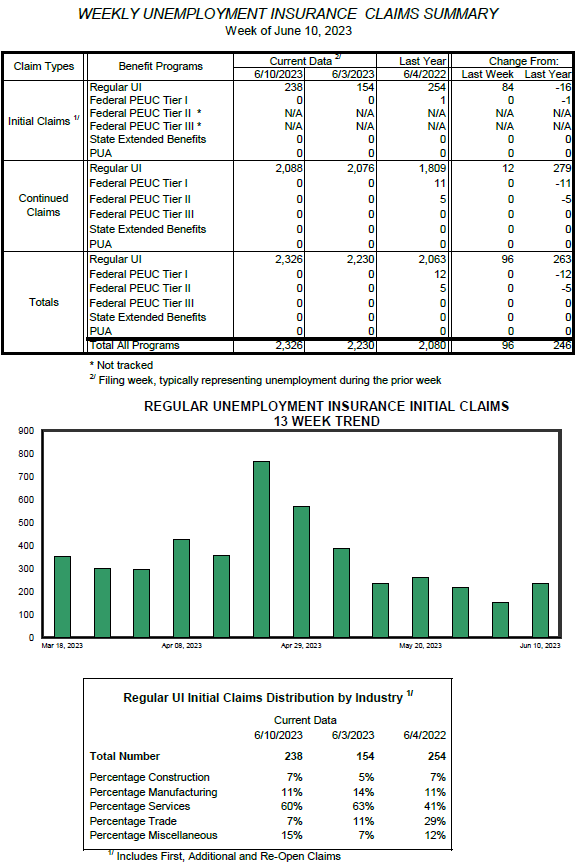
Weekly Unemployment Claims
Meanwhile, weekly unemployment claims increased last week but remain very low. For the week of June 10, 2023, claims were 238, up 84 from the previous week and down 16 from the same time last year. Total claims were 2,326, up 96 for the week and up 246 from last year.
As with the US unemployment rate, weekly claims last week nationally indicated more layoffs.
According to the US DOL, seasonally adjusted initial claims were 262,000, unchanged from the previous week's revised level. The previous week's level was revised up by 1,000 from 261,000 to 262,000. The 4-week moving average was 246,750, an increase of 9,250 from the previous week's revised average. This is the highest level for this average since November 20, 2021, when it was 249,250. The previous week's average was revised up by 250 from 237,250 to 237,500.
| State | May 2023(P) rate |
Rank |
|---|---|---|
|
Nebraska |
1.9 | 1 |
|
New Hampshire |
1.9 | 1 |
|
South Dakota |
1.9 | 1 |
|
North Dakota |
2.1 | 4 |
|
Vermont |
2.1 | 4 |
|
Alabama |
2.2 | 6 |
|
Montana |
2.3 | 7 |
|
Utah |
2.3 | 7 |
|
Maine |
2.4 | 9 |
|
Maryland |
2.4 | 9 |
|
Wisconsin |
2.4 | 9 |
|
Missouri |
2.5 | 12 |
|
Florida |
2.6 | 13 |
|
Idaho |
2.6 | 13 |
|
Arkansas |
2.7 | 15 |
|
Iowa |
2.7 | 15 |
|
Colorado |
2.8 | 17 |
|
Massachusetts |
2.8 | 17 |
|
Oklahoma |
2.8 | 17 |
|
Kansas |
2.9 | 20 |
|
Minnesota |
2.9 | 20 |
|
Virginia |
2.9 | 20 |
|
Rhode Island |
3.0 | 23 |
|
Hawaii |
3.1 | 24 |
|
Indiana |
3.1 | 24 |
|
South Carolina |
3.1 | 24 |
|
Georgia |
3.2 | 27 |
|
Mississippi |
3.2 | 27 |
|
Tennessee |
3.3 | 29 |
|
West Virginia |
3.3 | 29 |
|
Wyoming |
3.3 | 29 |
|
Arizona |
3.4 | 32 |
|
North Carolina |
3.4 | 32 |
|
New Mexico |
3.5 | 34 |
|
Alaska |
3.6 | 35 |
|
Louisiana |
3.6 | 35 |
|
New Jersey |
3.6 | 35 |
|
Ohio |
3.6 | 35 |
|
Connecticut |
3.7 | 39 |
|
Michigan |
3.7 | 39 |
|
Oregon |
3.7 | 39 |
|
Kentucky |
3.8 | 42 |
|
New York |
3.9 | 43 |
|
Pennsylvania |
4.0 | 44 |
|
Illinois |
4.1 | 45 |
|
Texas |
4.1 | 45 |
|
Washington |
4.1 | 45 |
|
Delaware |
4.2 | 48 |
|
California |
4.5 | 49 |
|
District of Columbia |
5.1 | 50 |
|
Nevada |
5.4 | 51 |
|
Footnotes |
||
|
Note: Rates shown are a percentage of the labor force. Data refer to place of residence. Estimates for the current month are subject to revision the following month. |
||

Last Modified Date: June 16, 2023
The Unemployment and Jobs Report for June is scheduled to be released on Friday, July 21st, 2023 at 10:00 a.m.