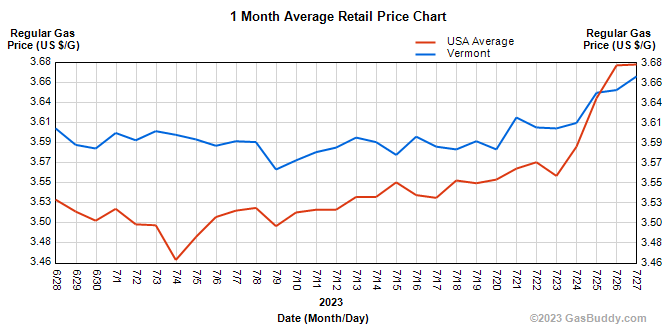
Vermont Business Magazine Average gasoline prices in Vermont are $3.66 per gallon, up 8 cents per gallon from last week's $3.58/g. Prices are up 7 cents/g from last month and down 84 cents from last year. The US average gas prices has surpassed the Vermont average.
The lowest price in the state is $3.40/g in Middlebury while the highest was $3.97/g in Stowe.
Average gasoline prices in Burlington have risen 1.4 cents per gallon in the last week, averaging $3.60/g today, according to GasBuddy's survey of 100 stations in Burlington. Prices in Burlington are 1.8 cents per gallon lower than a month ago and stand 88.8 cents per gallon lower than a year ago.
According to GasBuddy price reports, the cheapest station in Burlington was priced at $3.45/g yesterday while the most expensive was $3.69/g, a difference of 24.0 cents per gallon.
The national average price of gasoline has risen 8 cents per gallon in the last week, averaging $3.67/g today. The national average is up 13 cents per gallon from a month ago and stands 59 cents per gallon lower than a year ago, according to GasBuddy data compiled from more than 11 million weekly price reports covering over 150,000 gas stations across the country.
GasBuddy is also urging consumers to check gasoline prices along state borders, as prices may fluctuate wildly just across the border. See information below.
The national average price of diesel has risen 2.7 cents in the last week and stands at $3.83 per gallon.
Statistics
| Vermont | USA | Trend | |
|---|---|---|---|
| Today | 3.663 | 3.678 |  |
| Yesterday | 3.650 | 3.677 | |
| One Week Ago | 3.585 | 3.552 | |
| One Month Ago | 3.596 | 3.547 | |
| One Year Ago | 4.501 | 4.261 | |
| * Average Regular Gas Prices - Updated: 7.27.2023. 10:55 AM | |||
Historical gasoline prices in Burlington and the national average going back ten years:
July 24, 2022: $4.49/g (U.S. Average: $4.33/g)
July 24, 2021: $3.13/g (U.S. Average: $3.14/g)
July 24, 2020: $2.20/g (U.S. Average: $2.18/g)
July 24, 2019: $2.77/g (U.S. Average: $2.75/g)
July 24, 2018: $2.95/g (U.S. Average: $2.84/g)
July 24, 2017: $2.40/g (U.S. Average: $2.27/g)
July 24, 2016: $2.27/g (U.S. Average: $2.15/g)
July 24, 2015: $2.70/g (U.S. Average: $2.73/g)
July 24, 2014: $3.72/g (U.S. Average: $3.54/g)
July 24, 2013: $3.78/g (U.S. Average: $3.66/g)
Neighboring areas and their current gas prices:
Albany- $3.72/g, up 2.3 cents per gallon from last week's $3.69/g.
New Hampshire- $3.48/g, up 1.2 cents per gallon from last week's $3.46/g.
"For another week, we saw little meaningful change in the national average, which has been stuck in the same 10 cent range we're in today since April. It's been a remarkably quiet summer for gas prices, which have been far less active than normal," said Patrick De Haan, head of petroleum analysis at GasBuddy. "However, with tremendous heat gripping much of the country, I remain concerned about the fuel that such high temperatures will provide for tropical systems that venture into the Atlantic and Caribbean. For now, I don't expect much change in the toss up that has been gas prices for weeks on end. But, with gasoline demand now hitting its summer high, there remain some risks that could disturb gas prices in a significant way before summer's end."
Summer road trippers crossing through multiple states can waste over $10 every fill up by not paying attention to gas prices
As summer travel hits its peak, road trippers be warned: pay attention to state lines before filling up. GasBuddy, the leading fuel savings platform providing North American drivers with the most ways to save money on gas, today revealed the top 10 bordering U.S. states with the largest difference in gas prices. Travelers this summer could be wasting upwards of $1 per gallon, or over $10 every fill up, by failing to check gas prices before crossing state lines.
With inflation continuing to affect travel costs, and 64% of Americans planning to take a road trip this summer, saving money on gas is especially important in 2023. Gas prices between states vary due to factors such as state taxes and proximity to oil refineries and resulting transportation costs.
Top 10 “High Risk” States:
(State | Bordering State | Price Difference)
Arizona | California | $1.05/gal
Idaho | Washington | $1.00/gal
Idaho | Oregon | $0.67/gal
Nevada | California | $0.64/gal
Oklahoma | Colorado | $0.64/gal
Kentucky | Illinois | $0.58/gal
Missouri | Illinois | $0.57/gal
Kansas | Colorado | $0.52/gal
Iowa | Illinois | $0.49/gal
Indiana | Illinois | $0.48/gal
“Crossing state lines is often an exciting time for summer road trippers, signaling progress and new experiences. However, these milestones should also serve as a red flag to drivers,” said Patrick De Haan, head of petroleum analysis for GasBuddy. “The difference in gas prices among two bordering states can add up to over $10 on a single tank of gas, potentially costing American travelers hundreds on long road trips in some parts of the country. All it takes is 10 seconds to check gas prices on both sides of the border to avoid burning up more money on fuel than you need to. Why pay more?”
GasBuddy is the authoritative voice for gas prices and the only source for station-level data. GasBuddy's survey updates 288 times every day from the most diverse list of sources covering nearly 150,000 stations nationwide, the most comprehensive and up-to-date in the country. GasBuddy data is accessible at http://prices.GasBuddy.com.
SOURCE: DALLAS (July 25/27, 2023) -- GasBuddy