by Timothy McQuiston, Vermont Business Magazine Today, the Vermont Department of Labor reported that the November 2023 seasonally adjusted unemployment rate rose one-tenth to 2.1 percent. This is largely due to a significant increase in the Labor Market, which is the denominator in the calculation. The number of employed and unemployed also increased. Still, a vast number of jobs are going vacant, as employers seek out workers. The jobless rate also rose by a tenth in October. Vermont still has the fourth lowest jobless rate in the nation. Maryland is one with a 1.8 percent rate and Nevada is last at 5.4 percent.
The seasonally adjusted Vermont data for November show the Vermont civilian labor force increased by 1,166 from the prior month’s revised estimate (see Table 1). The number of employed persons increased by 759 and the number of unemployed persons increased by 407. The changes to the labor force, the number of unemployed persons and the unemployment rate were statistically significant in the seasonally adjusted series.
The civilian labor force participation rate was 64.4 percent in November, an increase of two-tenths of one percentage point from the prior month’s revised estimate.
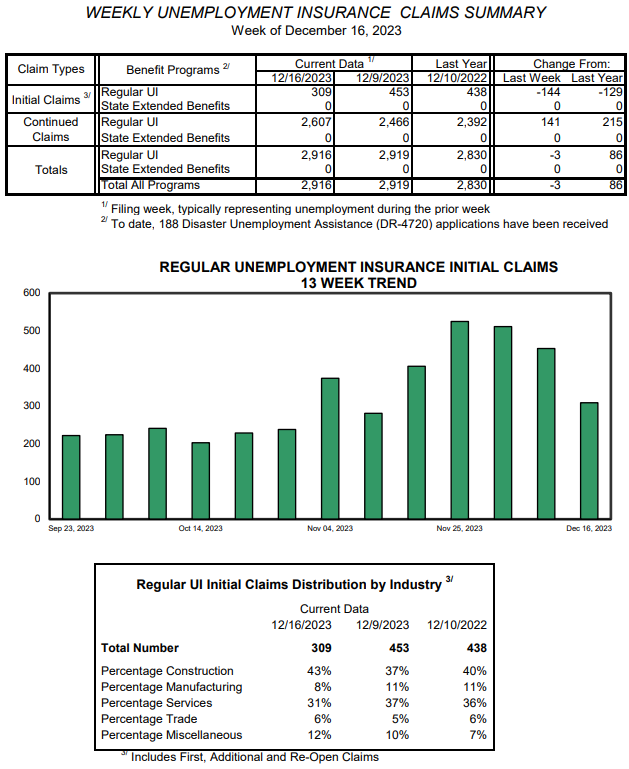
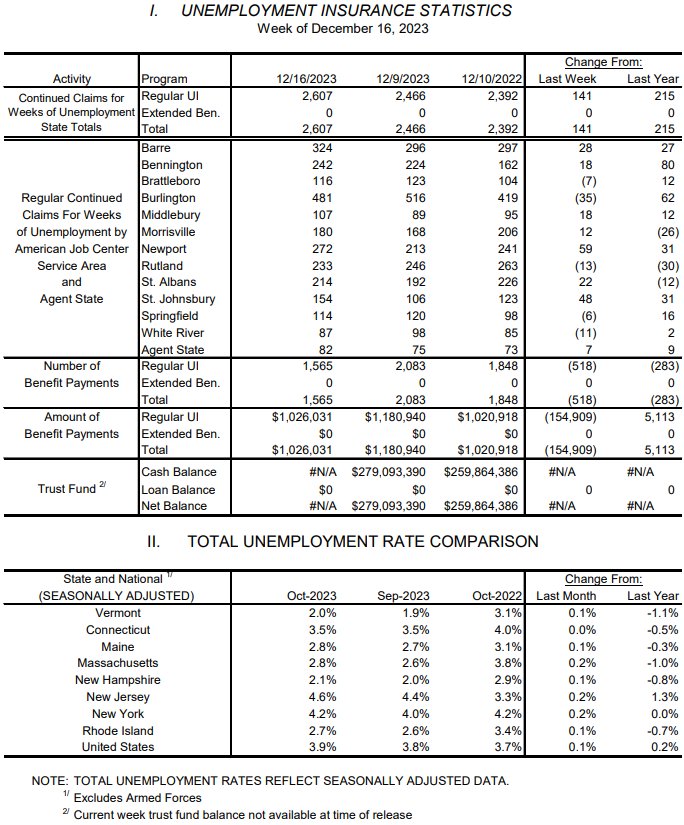
Meanwhile, weekly unemployment claims in Vermont fell back to a relatively low 309 (down 144 for the week, down 129 from the same time last year) after several higher weeks. The holiday season tends to be volatile, as retailers and hospitality ramp up for the season and then down following it.
(See detailed tables below)
US claims have been steadily falling since last summer. The US DOL reported that n the week ending December 16, the advance figure for seasonally adjusted initial claims was 205,000, an increase of 2,000 from the previous week's revised level. The previous week's level was revised up by 1,000 from 202,000 to 203,000. The 4-week moving average was 212,000, a decrease of 1,500 from the previous week's revised average.
The United States unemployment rate in November was 3.7 percent, a decrease of two-tenths of one percentage point from the revised October estimate.

Labor Commissioner Michael Harrington said: "The ongoing labor force expansion is welcome news to the Vermont economy. Surpassing the 350,000 mark holds significance as the Vermont labor force has remained below this level since April 2020. Several economic indicators resemble pre-recessionary levels, yet one notable exception is Vermont's persistently high number of job vacancies. While a surplus of job opportunities facilitates job hunting, navigating unemployment remains challenging. One of the many ways the Department supports job seekers is via a weekly newsletter promoting available jobs across Vermont. To receive this email, individuals can visit https://labor.vermont.gov/vt-labor-weekly-jobs-newsletter to register. This link also serves as a connection point for employers to Vermont Job Link, offering free access to list available positions. Several job opportunities from Vermont Job Link are highlighted in the newsletter each week.”
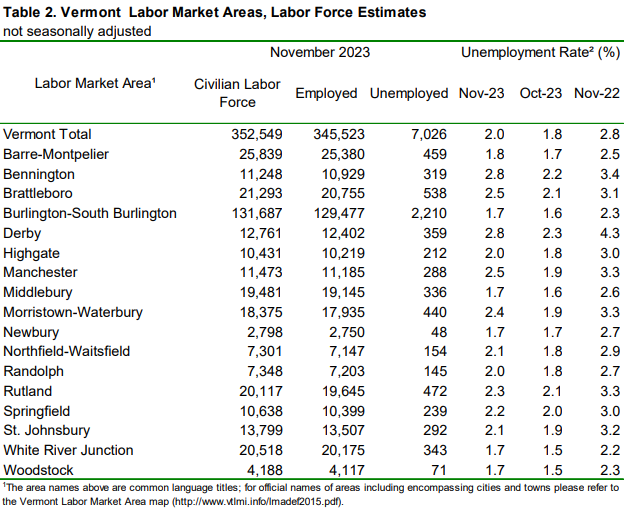
The November unemployment rates for Vermont’s 17 labor market areas ranged from 1.7 percent in Burlington-South Burlington, Middlebury, Newbury, Woodstock and White River Junction to 2.8 percent in Bennington and Derby (note: local labor market area unemployment rates are not seasonally-adjusted – see Table 2). For comparison, the November unadjusted unemployment rate for Vermont was 2.0 percent, an increase of two-tenths of one percentage point from the revised unadjusted October level and a decrease of eight-tenths of one percentage point from a year ago.
Seasonally Adjusted (Table 3)
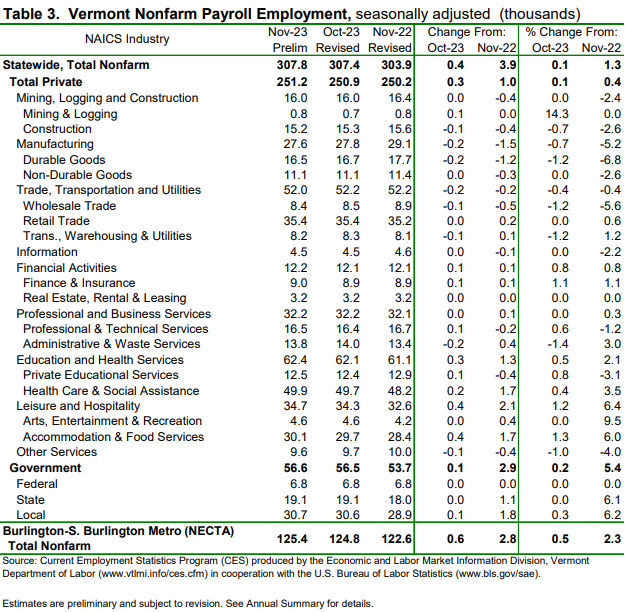
The seasonally adjusted data for November reported an increase of 400 jobs from the revised October data. There was a decrease of 300 jobs between the preliminary and the revised October estimates due to the inclusion of more data. The seasonally adjusted over-the-month changes in November were varied at the industry level. Those with a notable increase included: Accommodation & Food Services (+400 jobs or +1.3%) and Finance & Insurance (+100 jobs or +1.1%). Industries with a notable decrease included: Administrative & Waste Services (-200 jobs or -1.4%) and Durable Goods Manufacturing (-200 jobs or -1.2%).
Not-Seasonally Adjusted (Table 4)
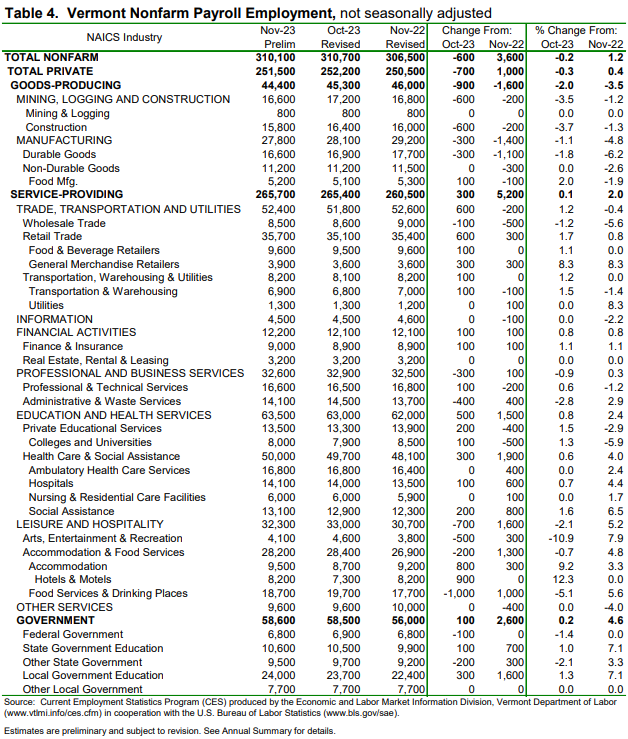
The preliminary ‘not-seasonally-adjusted’ jobs estimates for November showed a decrease of 600 jobs when compared to the revised October numbers. As with the seasonally adjusted data, this over-the-month change is from the revised October numbers which experienced a decrease of 100 jobs from the preliminary estimates. The broader economic picture can be seen by focusing on the over-the-year changes in this data series. As detailed in the preliminary not-seasonally-adjusted November data, Total Private industries increased by 1,000 jobs (+0.4%) over the year and Government (including public education) employment increased by 2,600 jobs (+4.6%) in the past year.
The Unemployment and Jobs Report for December is scheduled to be released on Tuesday, January 23, 2024 at 10:00 a.m.
| State | November 2023(P) rate |
Rank |
|---|---|---|
|
Maryland |
1.8 | 1 |
|
North Dakota |
1.9 | 2 |
|
South Dakota |
2.0 | 3 |
|
Vermont |
2.1 | 4 |
|
Nebraska |
2.3 | 5 |
|
New Hampshire |
2.3 | 5 |
|
Alabama |
2.4 | 7 |
|
Utah |
2.8 | 8 |
|
Florida |
2.9 | 9 |
|
Hawaii |
2.9 | 9 |
|
Kansas |
2.9 | 9 |
|
Massachusetts |
2.9 | 9 |
|
Rhode Island |
2.9 | 9 |
|
Virginia |
2.9 | 9 |
|
Maine |
3.0 | 15 |
|
Montana |
3.0 | 15 |
|
South Carolina |
3.0 | 15 |
|
Wyoming |
3.0 | 15 |
|
Minnesota |
3.1 | 19 |
|
Missouri |
3.2 | 20 |
|
Arkansas |
3.3 | 21 |
|
Colorado |
3.3 | 21 |
|
Idaho |
3.3 | 21 |
|
Iowa |
3.3 | 21 |
|
Mississippi |
3.3 | 21 |
|
Oklahoma |
3.3 | 21 |
|
Wisconsin |
3.3 | 21 |
|
Georgia |
3.4 | 28 |
|
Pennsylvania |
3.4 | 28 |
|
Louisiana |
3.5 | 30 |
|
North Carolina |
3.5 | 30 |
|
Tennessee |
3.5 | 30 |
|
Connecticut |
3.6 | 33 |
|
Ohio |
3.6 | 33 |
|
Oregon |
3.6 | 33 |
|
Indiana |
3.7 | 36 |
|
New Mexico |
3.9 | 37 |
|
Washington |
4.0 | 38 |
|
Texas |
4.1 | 39 |
|
Delaware |
4.2 | 40 |
|
West Virginia |
4.2 | 40 |
|
Arizona |
4.3 | 42 |
|
Kentucky |
4.3 | 42 |
|
Michigan |
4.3 | 42 |
|
New York |
4.3 | 42 |
|
Alaska |
4.4 | 46 |
|
Illinois |
4.7 | 47 |
|
New Jersey |
4.7 | 47 |
|
California |
4.9 | 49 |
|
District of Columbia |
5.0 | 50 |
|
Nevada |
5.4 | 51 |
|
Footnotes |
||
|
Note: Rates shown are a percentage of the labor force. Data refer to place of residence. Estimates for the current month are subject to revision the following month. |
||
Last Modified Date: December 22, 2023
Source: 12.22.2023. Vermont Dept of Labor. www.vtlmi.info. US DOL. www.bls.gov