The most sentenced federal crimes in Vermont
- In Vermont, federal sentences for Drug Trafficking are given most frequently
- Firearms ranks second
- Fraud/ Theft/ Embezzlement comes third
Vermont Business Magazine Defense attorneys Criminal Defense analyzed data from the United States Sentencing Commission for the fiscal year 2022 to determine the categories of crimes for which each state receives the most sentences.
The categories of crime that have the highest sentencing rates per 100,000 in Vermont are:
- Drug Trafficking - comes in as the most sentenced crime with a rate of 9.74 federal sentences per 100,000. Drug trafficking crimes involve knowingly manufacturing, dispensing, or distributing controlled substances or counterfeit controlled substances meant to be passed off as the real thing.
- Firearms - is the second most sentenced crime with a rate of 3.56 federal sentences per 100,000. Firearms offenses are committed when a defendant illegally possesses or uses a firearm.
- Fraud/ Theft/ Embezzlement - comes in third with a rate of 2.01 federal sentences per 100,000. Fraud is when any deception or misrepresentation is used to benefit someone, theft is the unlawful taking of someone else’s property, and embezzlement is theft while in a position of trust over the stolen funds or items.
- Drug Possession - with a rate of 1.08 federal sentences per 100,000. Drug possession crimes are committed when a defendant is in possession of controlled substances, either on their person or in an area they control, while either knowing of the existence of the controlled substances or being expected to know that controlled substances were present in that area.
- Immigration - with a rate of 0.77 federal sentences per 100,000. Immigration crime relates to the illegal entry of the United States by a foreign national or committing a felony offense as an immigrant to the United States.
SEE TABLES BELOW.
Speaking on behalf of Criminal Defense, a spokesperson commented on the study’s findings: “It is interesting to see which categories of crime receive the most federal sentences in each state, and it is even more fascinating to see some states having the highest rates in multiple categories. At a state level, it is vital that the right resources are utilized to discover how each state can be supported in improving how frequently they have to hand out these sentences.”
Table showing the top 3 crime categories with the highest sentencing rates per 100,000 in each state. Sexual crimes omitted
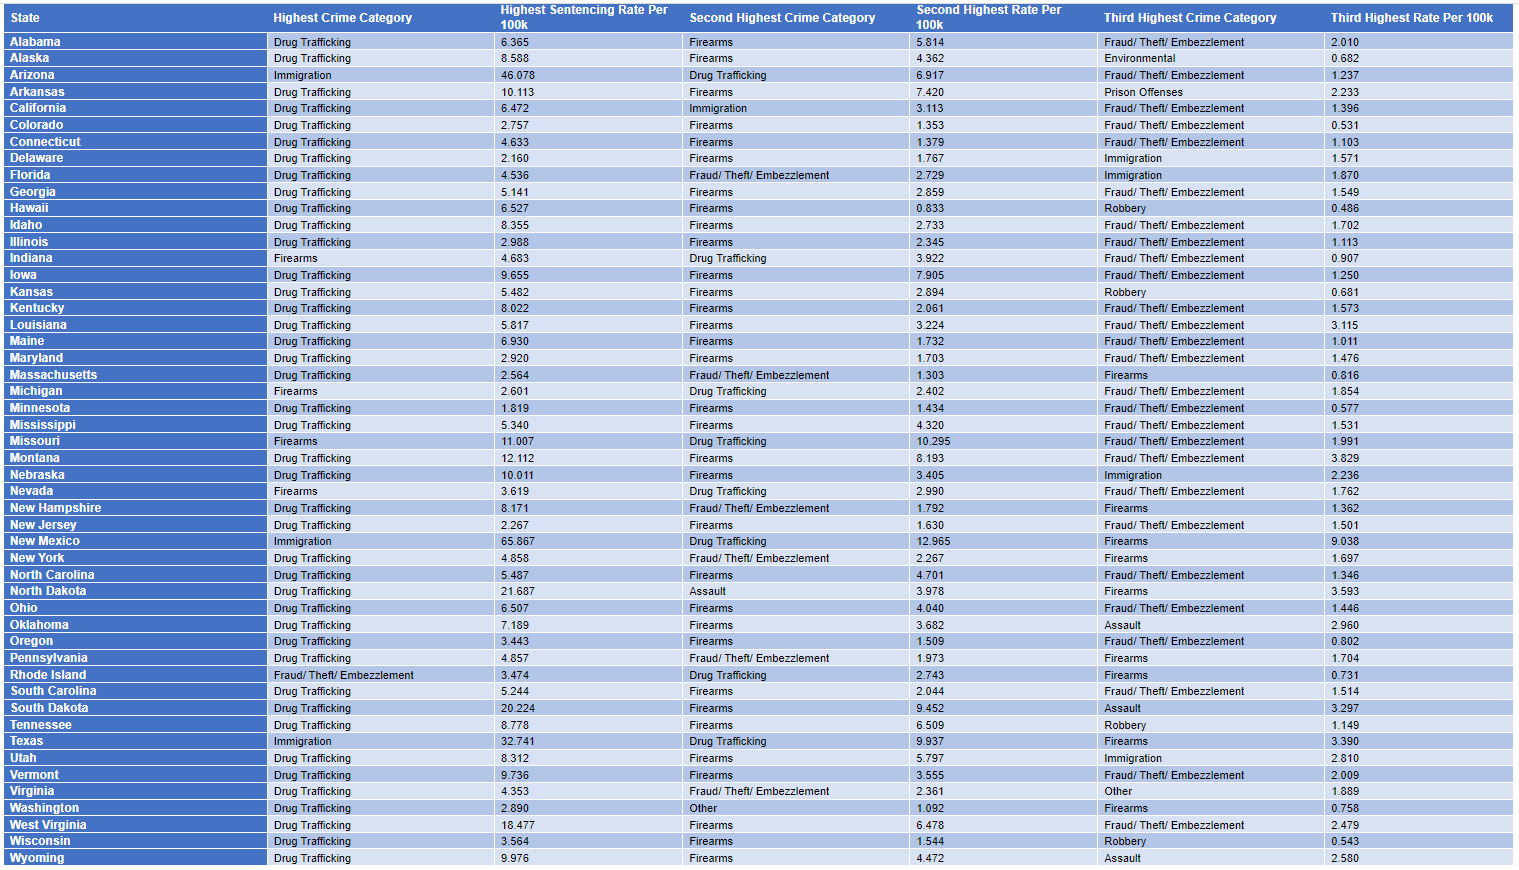
Table showing the fourth and fifth place crime categories with the highest sentencing rates per 100,000 in each state. Sexual crimes omitted
|
State |
Fourth Highest Crime Category |
Fourth Highest Rate Per 100k |
Fifth Highest Crime Category |
Fifth Highest Rate Per 100k |
|
Alabama |
Immigration |
0.512 |
Robbery |
0.414 |
|
Alaska |
Environmental |
0.682 |
Money Laundering |
0.545 |
|
Arizona |
Firearms |
1.141 |
Assault |
0.924 |
|
Arkansas |
Fraud/ Theft/ Embezzlement |
1.773 |
Money Laundering |
0.296 |
|
California |
Firearms |
0.907 |
Money Laundering |
0.374 |
|
Colorado |
Robbery |
0.445 |
Assault |
0.342 |
|
Connecticut |
Money Laundering |
0.276 |
Tax |
0.248 |
|
Delaware |
Fraud/ Theft/ Embezzlement |
0.589 |
Murder |
0.295 |
|
Florida |
Firearms |
1.686 |
Money Laundering |
0.387 |
|
Georgia |
Immigration |
1.127 |
Other |
0.962 |
|
Hawaii |
Fraud/ Theft/ Embezzlement |
0.417 |
Bribery/ Corruption |
0.278 |
|
Idaho |
Immigration |
1.496 |
Administration of Justice |
0.206 |
|
Illinois |
Robbery |
0.453 |
Money Laundering |
0.286 |
|
Indiana |
Robbery |
0.600 |
Money Laundering |
0.190 |
|
Iowa |
Immigration |
0.875 |
Assault |
0.750 |
|
Kansas |
Prison Offenses |
0.647 |
Fraud/ Theft/ Embezzlement |
0.613 |
|
Kentucky |
Immigration |
0.931 |
Money Laundering |
0.687 |
|
Louisiana |
Immigration |
0.414 |
Robbery |
0.349 |
|
Maine |
Immigration |
0.577 |
Administration of Justice |
0.217 |
|
Maryland |
Robbery |
0.454 |
Immigration |
0.422 |
|
Massachusetts |
Tax |
0.243 |
Immigration |
0.229 |
|
Michigan |
Immigration |
0.448 |
Robbery |
0.299 |
|
Minnesota |
Robbery |
0.367 |
Assault |
0.192 |
|
Mississippi |
Immigration |
1.054 |
Robbery |
0.306 |
|
Missouri |
Robbery |
0.955 |
Money Laundering |
0.793 |
|
Montana |
Assault |
1.781 |
Money Laundering |
0.534 |
|
Nebraska |
Fraud/ Theft/ Embezzlement |
1.270 |
Robbery |
0.762 |
|
Nevada |
Immigration |
0.976 |
Robbery |
0.724 |
|
New Hampshire |
Robbery |
0.358 |
Drug Possession |
0.143 |
|
New Jersey |
Immigration |
0.216 |
Money Laundering |
0.184 |
|
New Mexico |
Robbery |
1.703 |
Fraud/ Theft/ Embezzlement |
1.136 |
|
New York |
Immigration |
0.732 |
Robbery |
0.717 |
|
North Carolina |
Immigration |
1.019 |
Robbery |
0.794 |
|
North Dakota |
Fraud/ Theft/ Embezzlement |
2.182 |
Money Laundering |
1.797 |
|
Ohio |
Robbery |
0.400 |
Immigration |
0.281 |
|
Oklahoma |
Drug Possession |
1.592 |
Fraud/ Theft/ Embezzlement |
1.393 |
|
Oregon |
Money Laundering |
0.401 |
Assault |
0.377 |
|
Pennsylvania |
Robbery |
0.524 |
Immigration |
0.470 |
|
Rhode Island |
Money Laundering |
0.457 |
Tax |
0.366 |
|
South Carolina |
Money Laundering |
0.398 |
Tax |
0.246 |
|
South Dakota |
Fraud/ Theft/ Embezzlement |
2.858 |
Administration of Justice |
2.748 |
|
Tennessee |
Fraud/ Theft/ Embezzlement |
1.035 |
Money Laundering |
0.681 |
|
Texas |
Fraud/ Theft/ Embezzlement |
1.985 |
Money Laundering |
0.566 |
|
Utah |
Fraud/ Theft/ Embezzlement |
0.947 |
Money Laundering |
0.592 |
|
Vermont |
Drug Possession |
1.082 |
Immigration |
0.773 |
|
Virginia |
Firearms |
1.428 |
Immigration |
1.117 |
|
Washington |
Fraud/ Theft/ Embezzlement |
0.642 |
Immigration |
0.321 |
|
West Virginia |
Prison Offenses |
0.901 |
Money Laundering |
0.394 |
|
Wisconsin |
Fraud/ Theft/ Embezzlement |
0.458 |
Assault |
0.187 |
|
Wyoming |
Fraud/ Theft/ Embezzlement |
2.408 |
Tax |
1.032 |
Criminal Defense are defense lawyers specializing in providing legal defense in criminal cases exclusively through experienced attorneys, many of whom have previous experience in senior roles in the Department of Justice. https://criminaldefense.com/
Source: U.S. Sentencing Commission, 2022 Datafile, USSCFY22
https://www.ussc.gov/research/data-reports/geography/2022-federal-sentencing-statistics
Methodology
Data on the number of federal sentences given in each state in the fiscal year 2022 (October 1st, 2021, to September 30th, 2022) was obtained from the United States Sentencing Commission. This data was used to find the rate per 100,000 each state was being sentenced for federal crimes in various categories. The largest five sentencing rates in each state were then reported.