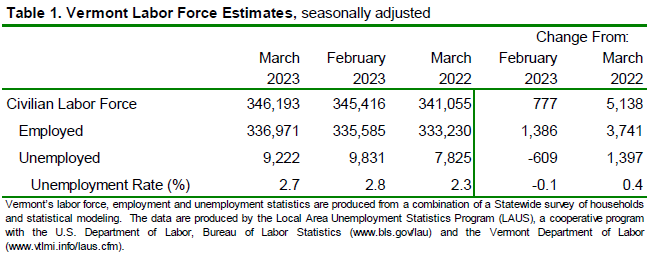
by Timothy McQuiston, Vermont Business Magazine Today, the Vermont Department of Labor reported that the seasonally adjusted statewide unemployment rate for March was 2.7 percent. This reflects a decrease of one-tenth of one percentage point from the prior month’s revised estimate. The rate is based on household data. All three of the major indices showed improvement as the spring economy warmed up. The civilian labor force participation rate was 63.7 percent in March, an increase of one-tenth of one percentage point from the prior month. The comparable United States rate in March was 3.5 percent, a decrease of one-tenth of one percentage point from the revised February estimate.
The seasonally adjusted Vermont data for March show the Vermont civilian labor force increased by 777 from the prior month’s revised estimate (see Table 1 above). The number of employed persons increased by 1,386 and the number of unemployed persons decreased by 609.
Vermont has the 13th lowest unemployment rate in the nation. New Hampshire is tied for sixth. South Dakota is lowest at 1.9% and Nevada is highest at 5.5% (see table below).
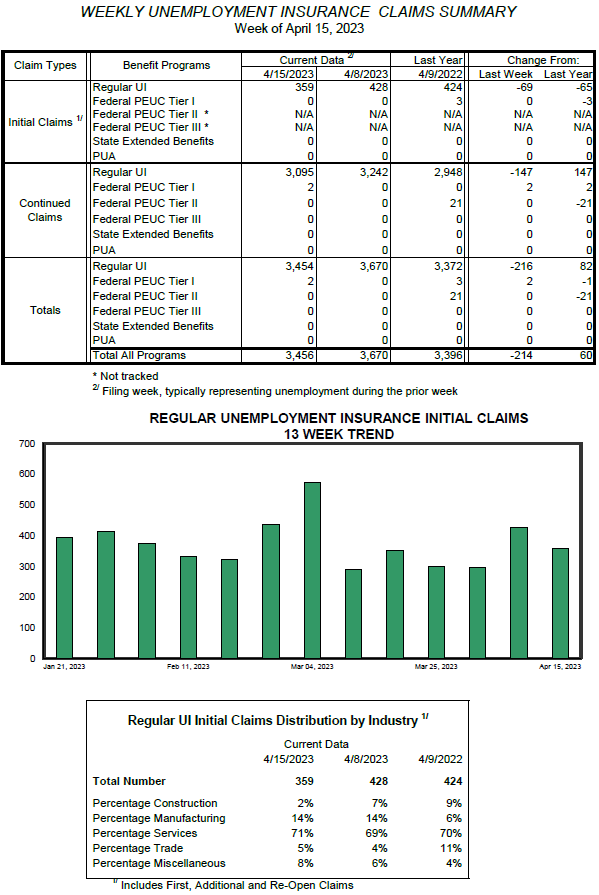
Meanwhile, Vermont weekly unemployment claims for the week ending April 15 fell last week after being somewhat elevated the week before. Initial claims are back to 365 for the week, down 69 from the previous week and down 65 from the same time last year. (see tables below)
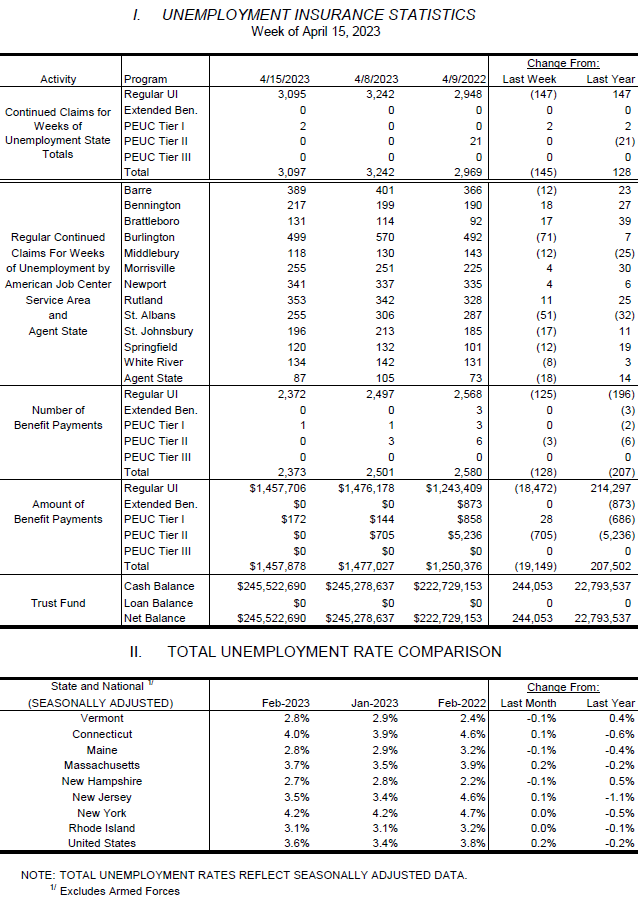
Nationally, UI claims were 245,000, an increase of 5,000 from the previous week's revised level. The previous week's level was revised up by 1,000 from 239,000 to 240,000. The 4-week moving average was 239,750, a decrease of 500 from the previous week's revised average.
The US labor scene remains relatively strong despite efforts by the Fed to slow the economy by raising interest rates to quell inflation. Inflation fell to 4.98% in March, down from $6.04 in February (the daily numbers indicate continuing decline). Inflation peaked at 9.06% in June 2022 (8.54% a year ago). Inflation rates had been under 2% before the COVID-19 pandemic. Inflation began to climb in March 2021, as federal stimulus money and a tight labor market emerged after the first year of the pandemic.
State tax revenues lag as economic caution ramps up
Labor Commissioner Michael Harrington said: “Vermont’s labor market continues to be strong with roughly two job openings for every unemployed Vermonter. Over the past twelve months the share of adults in the labor market grew from 63.0% to 63.7%, and in the past month almost 1,400 Vermonters have found work. These gains are a welcome development, but the state remains below its pre-pandemic levels. With numerous employers across the state looking for workers, it’s a great time to meet with a job specialist at one of the Department of Labor’s regional field offices located throughout the state. Our skilled team can assist with job searches, building a compelling resume and cover letter, conducting mock job interviews, and more. Additionally, the Department is hosting three job fairs in May: Middlebury Job Fair on May 4th, Rutland Job Fair on May 11th, and Bennington Job Fair on May 18th. So, if you’re a business looking to hire or a jobseeker on the hunt, be sure to visit www.VermontJobLink.com or connect with the specialists in one of our job centers at www.Labor.Vermont.gov/Jobs to find out more about our events and services.”
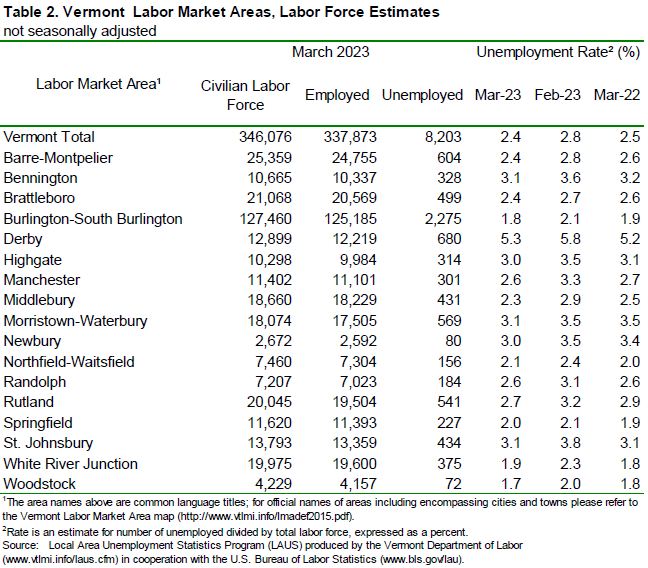
The March unemployment rates for Vermont’s 17 labor market areas ranged from 1.7 percent in Woodstock to 5.3 percent in Derby (note: local labor market area unemployment rates are not seasonally-adjusted – see Table 2). For comparison, the March unadjusted unemployment rate for Vermont was 2.4 percent, a decrease of four-tenths of one percentage point from the revised unadjusted February level and a decrease of one-tenth of one percentage point from a year ago.
Seasonally-Adjusted (Table 3)
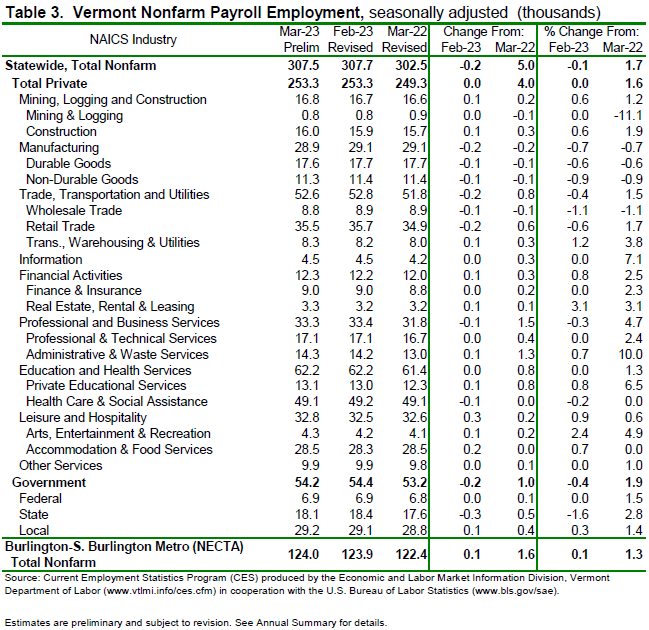
The seasonally-adjusted data for March reported a decrease of 200 jobs from the revised February data. There was an increase of 200 jobs between the preliminary and the revised February estimates due to the inclusion of more data. The seasonally-adjusted over-the-month changes in March were varied at the industry level. Those with a notable increase included: Real Estate, Rental and Leasing (+100 jobs or +3.1%), Arts, Entertainment & Recreation (+100 jobs or +2.4%) and Transportation, Warehousing and Utilities (+100 jobs or +1.2%). Industries with a notable decrease included: State Government (-300 jobs or -1.6%), Wholesale Trade (-100 jobs or -1.1%) and Non-Durable Goods (-100 jobs or -0.9%).
Not-Seasonally-Adjusted (Table 4)
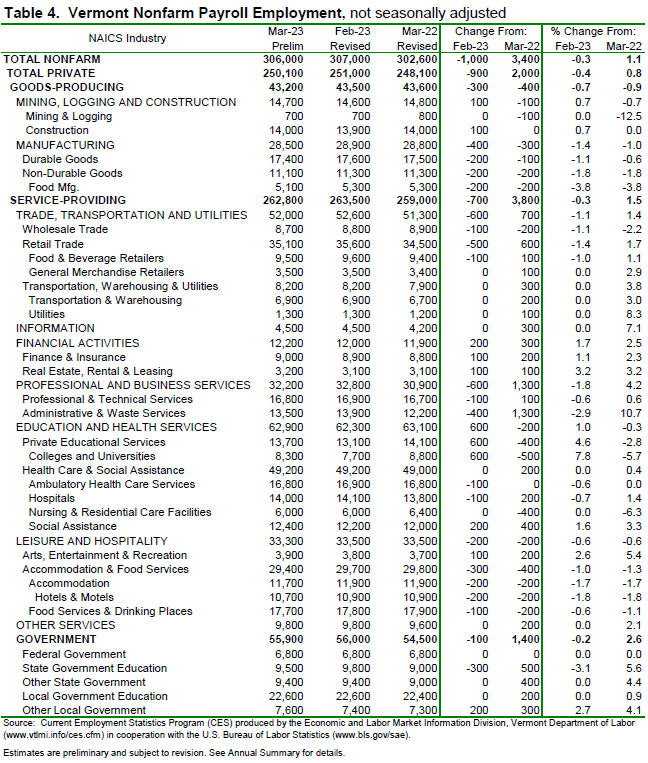
The preliminary ‘not-seasonally-adjusted’ jobs estimates for March showed a decline of 1,000 jobs when compared to the revised February numbers. As with the ‘seasonally-adjusted’ data, this over-the-month change is from the revised February numbers which experienced an increase of 400 jobs from the preliminary estimates. The broader economic picture can be seen by focusing on the over-the-year changes in this data series. As detailed in the preliminary ‘not-seasonally-adjusted’ March data, Total Private industries increased by 2,000 jobs (0.8%) over the year and Government (including public education) employment increased by 1,400 jobs (+2.6%) in the past year.
The Unemployment and Jobs Report for April is scheduled to be released on Friday, May 19th, 2023 at 10:00 a.m.
| State | March 2023(P) rate |
Rank |
|---|---|---|
|
South Dakota |
1.9 | 1 |
|
Nebraska |
2.1 | 2 |
|
North Dakota |
2.1 | 2 |
|
Alabama |
2.3 | 4 |
|
Montana |
2.3 | 4 |
|
New Hampshire |
2.4 | 6 |
|
Utah |
2.4 | 6 |
|
Missouri |
2.5 | 8 |
|
Wisconsin |
2.5 | 8 |
|
Florida |
2.6 | 10 |
|
Idaho |
2.6 | 10 |
|
Maine |
2.6 | 10 |
|
Maryland |
2.7 | 13 |
|
Vermont |
2.7 | 13 |
|
Colorado |
2.8 | 15 |
|
Iowa |
2.8 | 15 |
|
Minnesota |
2.8 | 15 |
|
Kansas |
2.9 | 18 |
|
Arkansas |
3.0 | 19 |
|
Oklahoma |
3.0 | 19 |
|
Georgia |
3.1 | 21 |
|
Indiana |
3.1 | 21 |
|
Rhode Island |
3.1 | 21 |
|
South Carolina |
3.2 | 24 |
|
Virginia |
3.2 | 24 |
|
Tennessee |
3.4 | 26 |
|
West Virginia |
3.4 | 26 |
|
Arizona |
3.5 | 28 |
|
Hawaii |
3.5 | 28 |
|
Massachusetts |
3.5 | 28 |
|
Mississippi |
3.5 | 28 |
|
New Jersey |
3.5 | 28 |
|
New Mexico |
3.5 | 28 |
|
North Carolina |
3.5 | 28 |
|
Louisiana |
3.6 | 35 |
|
Alaska |
3.7 | 36 |
|
Wyoming |
3.7 | 36 |
|
Kentucky |
3.8 | 38 |
|
Ohio |
3.8 | 38 |
|
Connecticut |
4.0 | 40 |
|
Texas |
4.0 | 40 |
|
Michigan |
4.1 | 42 |
|
New York |
4.1 | 42 |
|
Pennsylvania |
4.2 | 44 |
|
California |
4.4 | 45 |
|
Delaware |
4.4 | 45 |
|
Illinois |
4.4 | 45 |
|
Oregon |
4.4 | 45 |
|
Washington |
4.5 | 49 |
|
District of Columbia |
4.8 | 50 |
|
Nevada |
5.5 | 51 |
|
Footnotes |
||
|
Note: Rates shown are a percentage of the labor force. Data refer to place of residence. Estimates for the current month are subject to revision the following month. |
||
Last Modified Date: April 21, 2023
Source: 4.21.2023. Montpelier. Vermont Department of Labor, www.vtlmi.info
![]()