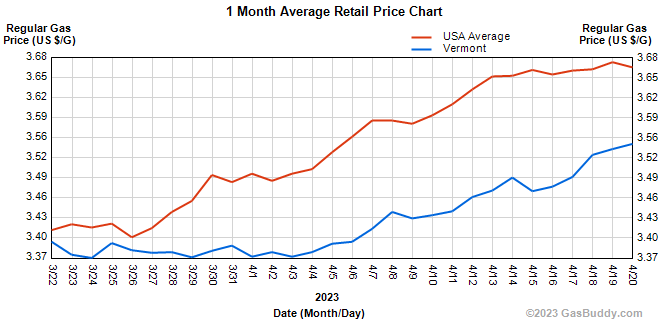
Vermont Business Magazine Average gasoline prices in Vermont today are $3.54 per gallon, this is an increase of 7 cents per gallon from last week, and 15 cents/g from a month ago, but 55 cents/g lower than a year ago, according to national analyst GasBuddy. The lowest price in the state yesterday is $3.29/g in Middlebury, Milton and Troy, while the highest was $3.79/g in Norwich, a difference of 50 cents per gallon.
Average gasoline prices in Burlington have risen 7.6 cents per gallon in the last week, averaging $3.48/g as of Monday, according to GasBuddy's survey of 100 stations in Burlington. Prices in Burlington are 4.3 cents per gallon higher than a month ago and stand 58.9 cents per gallon lower than a year ago. According to GasBuddy price reports, the cheapest station in Burlington was priced at $3.48/g yesterday while the most expensive was $3.48/g.
The national average price of gasoline has risen 1 cent per gallon in the last week, averaging $3.66/g today. The national average is up 25 cents per gallon from a month ago and stands 44 cents per gallon lower than a year ago, according to GasBuddy data compiled from more than 11 million weekly price reports covering over 150,000 gas stations across the country.
In addition, according to GasBuddy, Americans will pay about $78 billion in gas taxes this year (see below).
Meanwhile, the national average price of diesel has fallen 0.3 cents in the last week and stands at $4.15 per gallon.
Statistics
| Vermont | USA | Trend | |
|---|---|---|---|
| Today | 3.547 | 3.666 |  |
| Yesterday | 3.539 | 3.673 | |
| One Week Ago | 3.475 | 3.651 | |
| One Month Ago | 3.399 | 3.413 | |
| One Year Ago | 4.093 | 4.105 | |
| * Average Regular Gas Prices - Updated: 4.20.2023. 11:35 AM | |||
Historical gasoline prices in Burlington and the national average going back ten years:
April 17, 2022: $4.07/g (U.S. Average: $4.06/g)
April 17, 2021: $2.82/g (U.S. Average: $2.86/g)
April 17, 2020: $1.99/g (U.S. Average: $1.79/g)
April 17, 2019: $2.76/g (U.S. Average: $2.84/g)
April 17, 2018: $2.74/g (U.S. Average: $2.73/g)
April 17, 2017: $2.45/g (U.S. Average: $2.41/g)
April 17, 2016: $2.21/g (U.S. Average: $2.11/g)
April 17, 2015: $2.51/g (U.S. Average: $2.43/g)
April 17, 2014: $3.70/g (U.S. Average: $3.66/g)
April 17, 2013: $3.56/g (U.S. Average: $3.52/g)
Neighboring areas and their current gas prices:
Albany- $3.62/g, up 6.2 cents per gallon from last week's $3.56/g.
Vermont- $3.48/g, up 4.9 cents per gallon from last week's $3.43/g.
New Hampshire- $3.34/g, up 6.5 cents per gallon from last week's $3.27/g.
"With oil prices touching their highest level of 2023 at nearly $83 per barrel, the national average price of gasoline has continued to inch higher, with 45 of the nation's 50 states seeing prices rise over the last week. While the rising price of oil is likely the largest factor in rising gas prices, seasonal impacts continue to also exert pressure on prices," said Patrick De Haan, head of petroleum analysis at GasBuddy. "With the Northeast making the final step in the transition to summer gasoline this week, states in that region should expect a sharp rise in gasoline prices over the next week or two. Every other region has already seen the final step in the transition occur, so while other areas will see prices continue to slowly rise, the Northeast is likely to see a pretty hefty jump of 15-40 cents per gallon soon. Oil prices remain a wildcard, but we're likely a few weeks away from seeing the national average peak. Whether it hits $4 per gallon or not is still perhaps a 50/50 chance."
Taxes on gasoline amount to $215 million every day, one penny rise costs $1.38 billion per year for a total of $78 billion in 2023
While Americans raced to file their personal taxes ahead of Tuesday's deadline, Tax Day is every day for US drivers, according to GasBuddy. Gas prices have been rising over the past several weeks as Americans get back on the road and gear up for summer road trips - but there are some hidden costs buried in what Americans pay for gasoline that are driving up prices even more for many motorists around the country.
Every day, Americans spend $215 million on federal, state and local taxes on gasoline, with some states having lower taxes, and some having higher taxes. Some states also benefit from higher gasoline prices, with percentage-based sales taxes applied, helping the state to capture additional revenue when motorists are already getting hit with higher gas prices.
"While most Americans blame oil companies or gas stations for the high price of gasoline, few remember the portion Uncle Sam takes at the gas pump: 18.4 cents on every gallon in federal gas tax. But most states take even more than that and may not disclose at the pump how much tax is charged per gallon, causing motorists to target gas stations or oil companies instead of disclosing they are charging an average of 38.7 cents on every gallon,” said Patrick De Haan, head of petroleum analysis at GasBuddy. “Some states pinch motorists even more by having a percentage-based sales tax on gasoline. When gas prices hit a record last year, states saw money rolling in around the clock, in some places more than ever before.”
States with the highest and lowest state gasoline taxes:
Highest:
- California, 86.55c/gal
- Illinois, 78.0c/gal
- Pennsylvania, 77.1c/gal
- Hawaii, 70.1c/gal
- New Jersey, 69.1c/gal
Lowest:
- Alaska, 33.5c/gal
- Mississippi, 37.2c/gal
- New Mexico, 37.3c/gal
- Arizona, 37.4c/gal
- Missouri, 38.3c/gal
Motorists spend $483 million on federal gasoline taxes every week, or $25 billion every year, while state taxes amount to $145 million per day, totaling $53 billion per year. Increasing gasoline taxes at the state and federal level by just a penny would raise consumer’s tax bill by $2.75 billion per year. To save money at the pump, GasBuddy recommends drivers always shop around for the best prices in their area. While traveling this summer, drivers should watch out for state lines, where gas prices can significantly increase or decrease over a short distance.
GasBuddy is the authoritative voice for gas prices and the only source for station-level data. GasBuddy's survey updates 288 times every day from the most diverse list of sources covering nearly 150,000 stations nationwide, the most comprehensive and up-to-date in the country. GasBuddy data is accessible at http://prices.GasBuddy.com.
SOURCE: GasBuddy. Boston. 4.20.2023. www.vermontgasprices.com