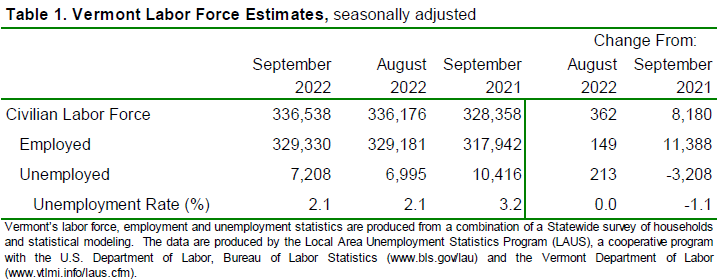
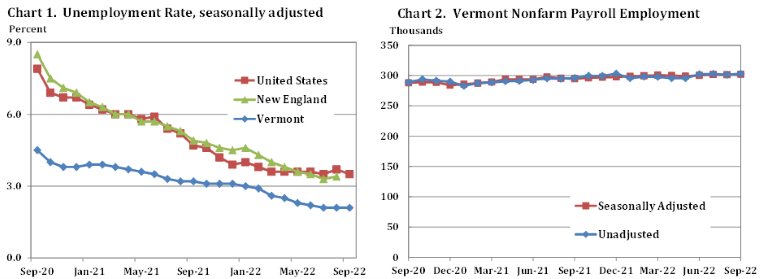
by Timothy McQuiston, Vermont business Magazine Today, the Vermont Department of Labor reported that the seasonally adjusted statewide unemployment rate for September was 2.1 percent. This reflects no change from the last two month’s revised estimates. Vermont is tied for the second lowest rate in the nation. Minnesota is lowest at 2.0 percent. New Hampshire is at 2.2 percent, tied for fourth. Illinois (4.5 percent) has the highest rate (see table below). The civilian labor force participation in Vermont was 61.8 percent in September, no change from the prior month. The participation rate had been edging up the last few months. The unemployment rate is based on household data collected by the US Census.
The comparable United States rate in September was 3.5 percent, a decrease of two-tenths of one percentage point from the revised August estimate. The seasonally adjusted Vermont data for September show the Vermont civilian labor force increased by 362 from the prior month’s revised estimate (see Table 1). The number of employed persons increased by 149 and the number of unemployed persons increased by 213. None of the changes were statistically significant in the seasonally adjusted series.
Labor Commissioner Michael Harrington said: "In October, the State of Vermont highlighted careers in some of the most in-demand industries in Vermont, working with local and statewide partners to generate awareness for jobs in manufacturing, construction, healthcare, tourism, and hospitality. We continue to help connect Vermonters with the great opportunities that exist across the state in these sectors. These efforts with be furthered in the coming weeks, with a number of hiring events, including those focused on promoting the employment of veterans and the recognition of National Apprenticeship Week in November. More information on these events and resources can be found on the Department website at Labor.Vermont.gov or by calling 833-719-1051.”
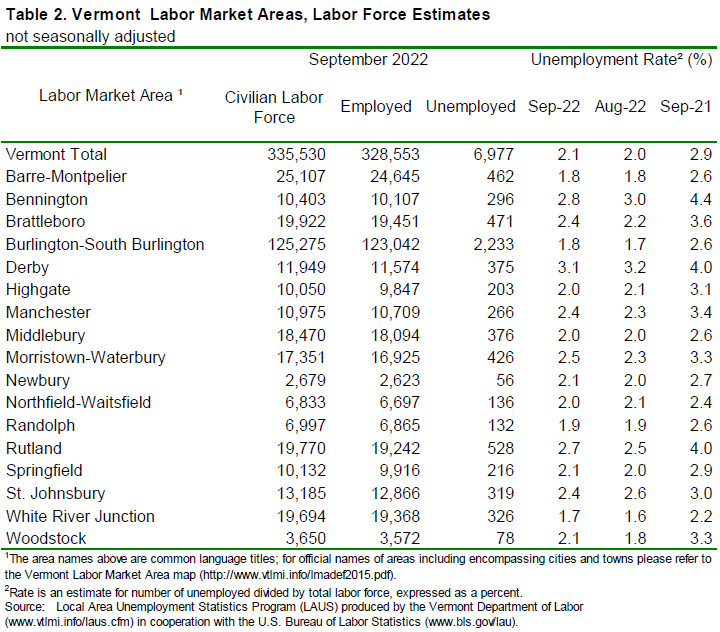
The September unemployment rates for Vermont’s 17 labor market areas ranged from 1.7 percent in White River Junction to 3.1 percent in Derby (note: local labor market area unemployment rates are not seasonally-adjusted – see Table 2). For comparison, the September unadjusted unemployment rate for Vermont was 2.1 percent, an increase of one-tenth of one percentage point from the revised unadjusted August level and a decrease of eight-tenths of one percentage point from a year ago.
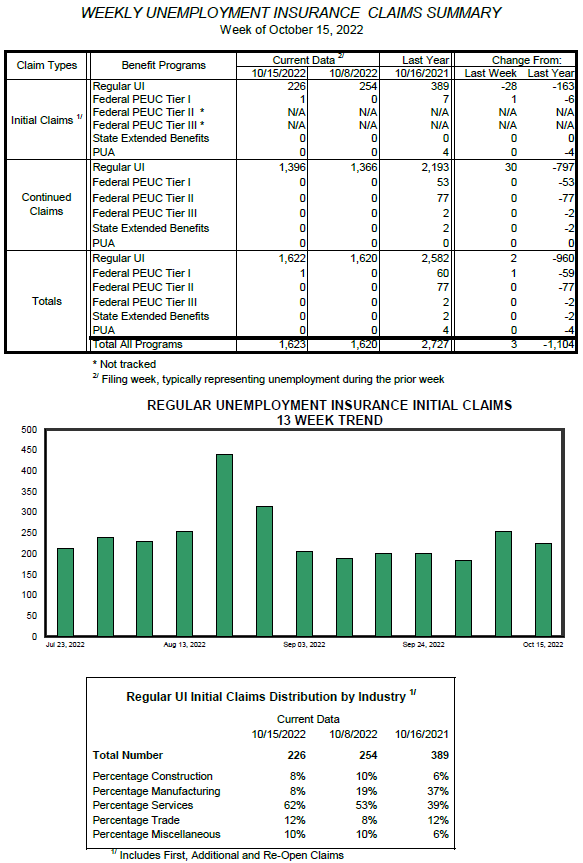
Meanwhile, unemployment insurance claims for the week of October 15 fell to 226 (down 28 from the prior week and down 163 from last year). Historically, this is a very low number. Total claims, including ongoing ones, were 1,623, up 2 from last week and down 960 from last year
The majority of claims were in the Service industry, with 62 percent of claims, up 9 percent from last week and up 23 percent from last year. But the actual claims are about the same, as total claims year-over-year have fallen. (see tables below).
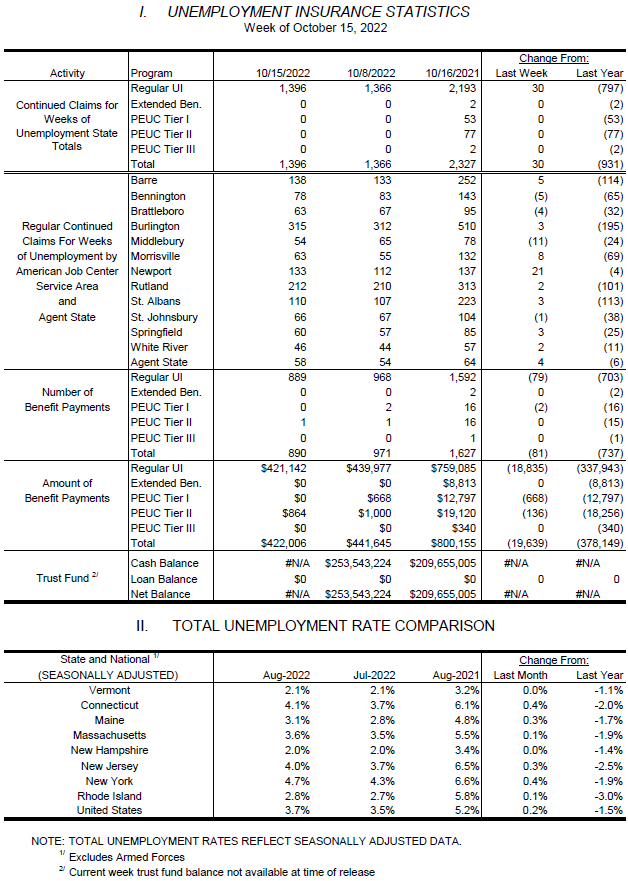
The Unemployment Insurance Trust Fund, which was well stocked before the pandemic hit in March 2020 with over $500 million, is holding at over $250 million, as of October 8 (data for this week was not available)
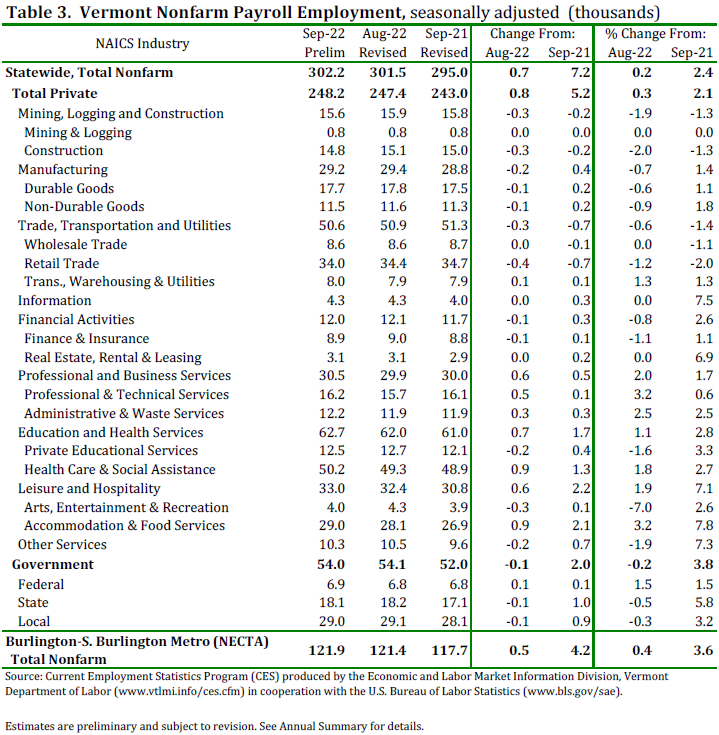
Seasonally Adjusted (Table 3)
The seasonally adjusted data for September reported an increase of 700 jobs from the revised August data. There was an increase of 200 jobs between the preliminary and the revised August estimates due to the inclusion of more data. The seasonally adjusted over-the-month changes in September were varied at the industry level. Those with a notable increase included: Accommodation & Food Services (+900 jobs or +3.2%), Professional & Technical Services (+500 jobs or +3.2%), and Administrative and Waste Services (+300 jobs or +2.5%). Industries with a notable decrease included: Arts, Entertainment, and Recreation (-300 jobs or -7.0%), Construction (-300 jobs or -2.0%), and Other Services (-200 jobs or -1.9%).
Not Seasonally Adjusted (Table 4)
The preliminary ‘not-seasonally-adjusted’ jobs estimates for September showed an increase of 1,700 jobs when compared to the revised August numbers. As with the ‘seasonally-adjusted’ data, this over-the-month change is from the revised August numbers which experienced a decrease of 800 jobs from the preliminary estimates. The broader economic picture can be seen by focusing on the over-the-year changes in this data series. As detailed in the preliminary ‘not-seasonally-adjusted’ September data, Total Private industries increased by 5,100 jobs (+2.1%) over the year and Government (including public education) employment increased by 2,000 jobs (+3.8%) in the past year.
The Unemployment and Jobs Report for August is scheduled to be released on Friday, November 18 at 10:00 a.m. View the most recent report at http://www.vtlmi.info/

| State | September 2022(P) rate |
Rank |
|---|---|---|
|
Minnesota |
2.0 | 1 |
|
Utah |
2.1 | 2 |
|
Vermont |
2.1 | 2 |
|
Nebraska |
2.2 | 4 |
|
New Hampshire |
2.2 | 4 |
|
North Dakota |
2.2 | 4 |
|
South Dakota |
2.3 | 7 |
|
Missouri |
2.4 | 8 |
|
Florida |
2.5 | 9 |
|
Alabama |
2.6 | 10 |
|
Kansas |
2.6 | 10 |
|
Virginia |
2.6 | 10 |
|
Iowa |
2.7 | 13 |
|
Georgia |
2.8 | 14 |
|
Idaho |
2.8 | 14 |
|
Indiana |
2.8 | 14 |
|
Montana |
2.9 | 17 |
|
Rhode Island |
3.1 | 18 |
|
Oklahoma |
3.2 | 19 |
|
South Carolina |
3.2 | 19 |
|
Wisconsin |
3.2 | 19 |
|
Maine |
3.3 | 22 |
|
New Jersey |
3.3 | 22 |
|
Wyoming |
3.3 | 22 |
|
Colorado |
3.4 | 25 |
|
Louisiana |
3.4 | 25 |
|
Massachusetts |
3.4 | 25 |
|
Tennessee |
3.4 | 25 |
|
Arkansas |
3.5 | 29 |
|
Hawaii |
3.5 | 29 |
|
Mississippi |
3.6 | 31 |
|
North Carolina |
3.6 | 31 |
|
Arizona |
3.7 | 33 |
|
Washington |
3.7 | 33 |
|
Kentucky |
3.8 | 35 |
|
Oregon |
3.8 | 35 |
|
California |
3.9 | 37 |
|
Connecticut |
4.0 | 38 |
|
Maryland |
4.0 | 38 |
|
Ohio |
4.0 | 38 |
|
Texas |
4.0 | 38 |
|
West Virginia |
4.0 | 38 |
|
Michigan |
4.1 | 43 |
|
Pennsylvania |
4.1 | 43 |
|
New Mexico |
4.2 | 45 |
|
Delaware |
4.3 | 46 |
|
New York |
4.3 | 46 |
|
Alaska |
4.4 | 48 |
|
Nevada |
4.4 | 48 |
|
Illinois |
4.5 | 50 |
|
District of Columbia |
4.7 | 51 |
|
Footnotes |
||
|
Note: Rates shown are a percentage of the labor force. Data refer to place of residence. Estimates for the current month are subject to revision the following month. |
||
![]()
10.21.2022. Vermont Department of Labor Montpelier www.labor.vermont.gov