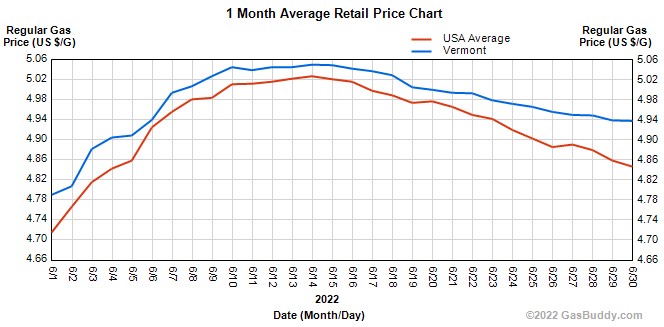
Vermont Business Magazine Average gasoline prices in Vermont fell 4 cents this week to $4.93 per gallon, as gas in general has come down the last two weeks, when they peaked at $5/g, if only slightly. Gas prices were $4.71 a month ago and $2.99 a year ago. The US price today is $4.84, down 10 cents for the week.
The lowest price in Vermont was $4.59 in Arlington and the highest price was $5.29 in Brattleboro.
However, Vermont is raising its gasoline tax 4 cents per gallon as of July 1.
Statistics
| Vermont | USA | Trend | |
|---|---|---|---|
| Today | 4.938 | 4.847 |  |
| Yesterday | 4.939 | 4.859 | |
| One Week Ago | 4.979 | 4.942 | |
| One Month Ago | 4.717 | 4.606 | |
| One Year Ago | 2.996 | 3.128 | |
| * Average Regular Gas Prices - Updated: 6/30/2022 3:35 PM | |||
Meanwhile, average gasoline prices in Burlington have fallen 4.4 cents per gallon in the last week, averaging $4.95/g, according to GasBuddy's survey of 100 stations in Burlington. Prices in Burlington are 15.8 cents per gallon higher than a month ago and stand $1.95/g higher than a year ago. The price of diesel has risen 2.6 cents nationally in the past week and stands at $5.80 per gallon.
According to GasBuddy price reports, the cheapest station in Burlington was priced at $4.85/g yesterday while the most expensive was $4.99/g, a difference of 14.0 cents per gallon. The lowest price in the state yesterday was $4.75/g while the highest was $5.09/g, a difference of 34.0 cents per gallon.
The national average price of gasoline has fallen 8.8 cents per gallon in the last week, averaging $4.88/g today. The national average is up 28.3 cents per gallon from a month ago and stands $1.79/g higher than a year ago, according to GasBuddy data compiled from more than 11 million weekly price reports covering over 150,000 gas stations across the country.
Historical gasoline prices in Burlington and the national average going back ten years:
June 27, 2021: $3.00/g (U.S. Average: $3.09/g)
June 27, 2020: $2.13/g (U.S. Average: $2.17/g)
June 27, 2019: $2.71/g (U.S. Average: $2.71/g)
June 27, 2018: $2.98/g (U.S. Average: $2.85/g)
June 27, 2017: $2.38/g (U.S. Average: $2.24/g)
June 27, 2016: $2.36/g (U.S. Average: $2.30/g)
June 27, 2015: $2.78/g (U.S. Average: $2.78/g)
June 27, 2014: $3.75/g (U.S. Average: $3.68/g)
June 27, 2013: $3.56/g (U.S. Average: $3.52/g)
June 27, 2012: $3.66/g (U.S. Average: $3.37/g)
Neighboring areas and their current gas prices:
Albany- $4.89/g, down 5.6 cents per gallon from last week's $4.95/g.
New Hampshire- $4.86/g, down 8.0 cents per gallon from last week's $4.94/g.
"With Independence Day a week away, gas prices have continued to fall for the second straight week as the price of oil has faltered, ushering in the drop we're seeing. The good news is we could also see a third straight week of decline," said Patrick De Haan, head of petroleum analysis at GasBuddy. "While prices will be at their highest July 4th level ever, they'll have fallen close to 20 cents since our peak in early June. Motorists should be wary that while the decline could continue for the week ahead, any sudden jolts to supply could quickly cause a turnaround, and risk remains that when the peak of hurricane season arrives, we could see a super spike at the pump."
GasBuddy is the authoritative voice for gas prices and the only source for station-level data spanning nearly two decades. Unlike AAA's once daily survey and the Lundberg Survey, updated once every two weeks based on a small fraction of U.S. gasoline stations, GasBuddy's survey updates 288 times every day from the most diverse list of sources covering nearly 150,000 stations nationwide, the most comprehensive and up-to-date in the country. GasBuddy data is accessible at http://prices.GasBuddy.com.
SOURCE GasBuddy 4.27 & 30, 2022. http://www.vermontgasprices.com/