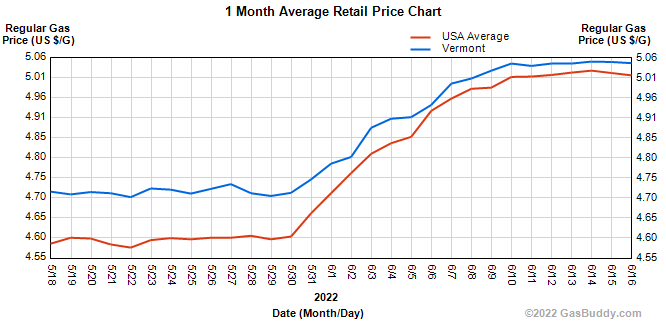
Vermont Business Magazine Average gasoline prices rose to a new record in the US, but weekly increases have slowed. Vermont gas prices are averaging $5.04 per gallon today, up 2 cents from last week, according to national analysts GasBuddy. The US average is $5.01/g, up 3 cents.
The highest prices in Vermont are found in Brattleboro ($5.29), and Arlington, Waitsfield and Richmond ($5.19). The lowest prices are reported in Middlebury ($4.79) and Manchester Center ($4.88).
As of today, Vermont gasoline prices were up 42 cents for the month and $2.08 for the year.
Average gasoline prices in Burlington, as of Monday, have risen 11.8 cents per gallon in the last week, averaging $5.07/g today, according to GasBuddy's survey of 100 stations in Burlington. Prices in Burlington are 45.4 cents per gallon higher than a month ago and stand $2.12/g higher than a year ago. The price of diesel has fallen 4.0 cents nationally in the past week and stands at $5.50 per gallon.
Demand has slowed only slightly despite the record prices as Americans are still willing to hit the road.
Statistics
| Vermont | USA | Trend | |
|---|---|---|---|
| Today | 5.046 | 5.016 |  |
| Yesterday | 5.049 | 5.021 | |
| One Week Ago | 5.027 | 4.984 | |
| One Month Ago | 4.621 | 4.513 | |
| One Year Ago | 2.963 | 3.081 | |
| * Average Regular Gas Prices - Updated: 6.16.2022. 11:15 AM | |||
According to GasBuddy price reports, the cheapest station in Burlington was priced at $4.97/g Sunday while the most expensive was $5.19/g, a difference of 22.0 cents per gallon.
As of Sunday, the national average price of gasoline rose 15.7 cents per gallon in the last week. The national average is up 57.1 cents per gallon from a month ago and stands $1.94/g higher than a year ago, according to GasBuddy data compiled from more than 11 million weekly price reports covering over 150,000 gas stations across the country.
Historical gasoline prices in Burlington and the national average going back ten years:
June 13, 2021: $2.95/g (U.S. Average: $3.07/g)
June 13, 2020: $2.06/g (U.S. Average: $2.10/g)
June 13, 2019: $2.76/g (U.S. Average: $2.70/g)
June 13, 2018: $2.99/g (U.S. Average: $2.90/g)
June 13, 2017: $2.44/g (U.S. Average: $2.32/g)
June 13, 2016: $2.36/g (U.S. Average: $2.38/g)
June 13, 2015: $2.79/g (U.S. Average: $2.80/g)
June 13, 2014: $3.74/g (U.S. Average: $3.65/g)
June 13, 2013: $3.59/g (U.S. Average: $3.63/g)
June 13, 2012: $3.78/g (U.S. Average: $3.54/g)
Neighboring areas and their gas prices as of Monday:
Albany- $4.96/g, up 16.4 cents per gallon from last week's $4.79/g.
New Hampshire- $4.98/g, up 9.1 cents per gallon from last week's $4.89/g.
“For the first time ever, last week saw the national average reach the $5 per gallon mark, as nearly every one of the nation's 50 states saw prices jump. For now, the upward momentum may slow down, but prices are still just one potential supply jolt away from heading even higher," said Patrick De Haan, head of petroleum analysis at GasBuddy. "Gasoline demand, while rising seasonally, is still well below previous records, but remains impressive with prices in all states at record levels. Should the rise in price finally start to slow demand, we could see some breathing room, but for now, it seems like Americans are proving resilient to record highs."
GasBuddy is the authoritative voice for gas prices and the only source for station-level data spanning nearly two decades. Unlike AAA's once daily survey and the Lundberg Survey, updated once every two weeks based on a small fraction of U.S. gasoline stations, GasBuddy's survey updates 288 times every day from the most diverse list of sources covering nearly 150,000 stations nationwide, the most comprehensive and up-to-date in the country. GasBuddy data is accessible at http://prices.GasBuddy.com.
SOURCE GasBuddy (June 13, 2022) (June 16, 2022) - Boston