
Vermont Business Magazine Today, the Vermont Department of Labor announced that the seasonally-adjusted statewide unemployment rate for June was 2.2 percent. This reflects a decrease of one-tenth of one percentage point from the prior month’s revised estimate. The civilian labor force participation rate rose to 61.6 percent in June. All three major metrics showed improvement, as the total labor force and employed increased and the number of unemployed fell.
The state jobless rate is now back to its very low, pre-pandemic level and is fifth lowest in the nation. Minnesota is lowest at 1.8 percent and New Mexico is highest at 4.9 percent. New Hampshire is third lowest at 2.0 percent. The comparable United States rate in June was 3.6 percent, which experienced no change from the revised May estimate.
Labor Commissioner Michael Harrington said: “The summer months are historically a busy time for hiring and this year is proving to be no different. Job postings continue to be high, and employers are filling at a record pace. To assist, the Department of Labor is organizing hiring events across the state, and in some unique locations, like partnering with the Upper Valley Nighthawks, Vermont Mountaineers, and Vermont Lake Monsters baseball teams in order to link employers with potential talent. Whether you’re looking for work or workers, visit Labor.Vermont.gov/Jobs for information on events and services in your area.”
WRJ to lead-off Triple Play Job Fest for DOL, State Workforce Development Board
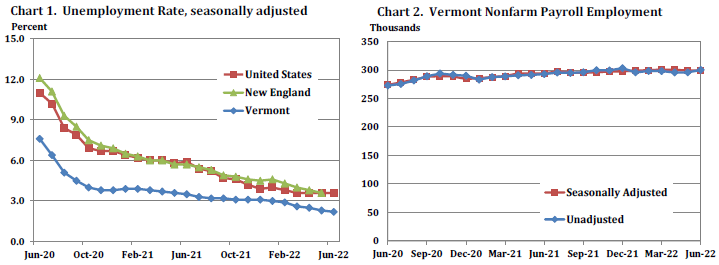
The seasonally-adjusted Vermont data for June show the Vermont civilian labor force increased by 1,120 from the prior month’s revised estimate (see Table 1). The number of employed persons increased by 1,431 and the number of unemployed persons decreased by 311. The changes to the labor force and number of employed were statistically significant in the seasonally-adjusted series.
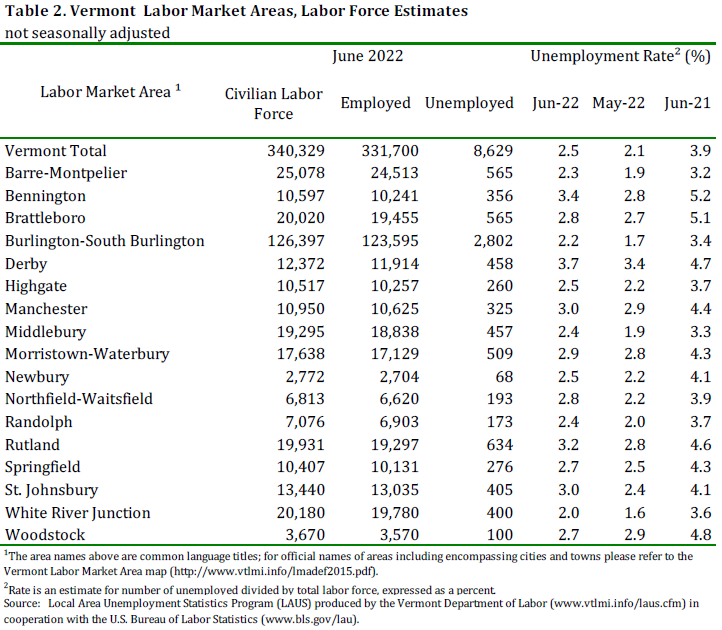
The June unemployment rates for Vermont’s 17 labor market areas ranged from 2.0 percent in White River Junction to 3.7 percent in Derby (note: local labor market area unemployment rates are not seasonally-adjusted – see Table 2). For comparison, the June unadjusted unemployment rate for Vermont was 2.5 percent, an increase of four-tenths of one percentage point from the revised unadjusted May level and a decrease of one and four-tenths percentage points from a year ago.
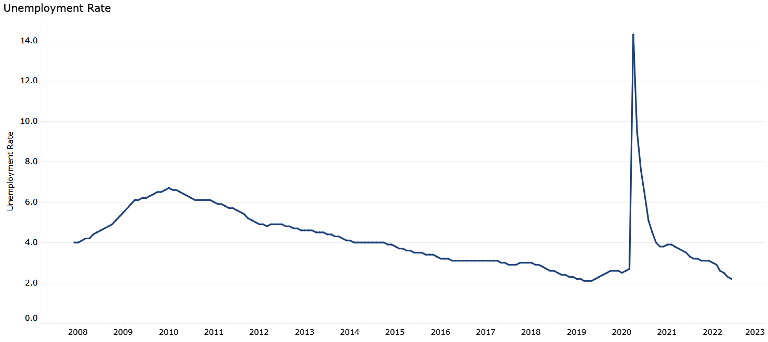
Vermont's unemployment rates since before the Great Recession to June 2022.
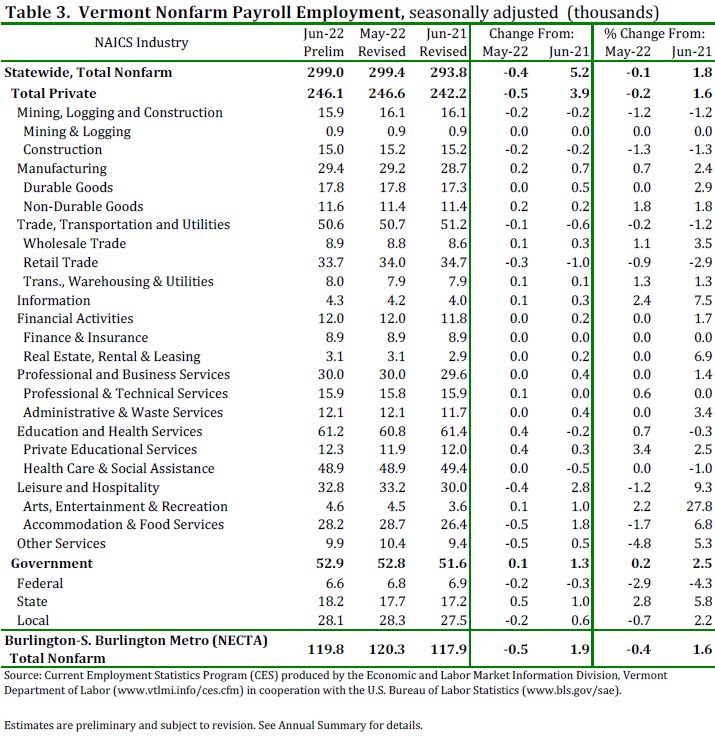
The seasonally-adjusted data for June reported a decrease of 400 jobs from the revised May data. There was a decrease of 300 jobs between the preliminary and the revised May estimates due to the inclusion of more data. The seasonally-adjusted over-the-month changes in June were varied at the industry level. Those with a notable increase included: Private Educational Services (+400 jobs or +3.4%) and State Government (+500 jobs or +2.8%). Industries with a notable decrease included: Other Services (-500 jobs or -4.8%) and Federal Government (-200 jobs or -2.9%).

The preliminary ‘not-seasonally-adjusted’ jobs estimates for June showed an increase of 4,200 jobs when compared to the revised May numbers. As with the ‘seasonally-adjusted’ data, this over-the-month change is from the revised May numbers which experienced an increase of 300 jobs from the preliminary estimates. The broader economic picture can be seen by focusing on the over-the-year changes in this data series. As detailed in the preliminary ‘not-seasonally-adjusted’ June data, Total Private industries increased by 5,900 jobs (+2.4%) over the year and Government (including public education) employment has increased by 1,300 jobs (+2.6%) in the past year.
The Unemployment and Jobs Report for July is scheduled to be released on Friday, August 19 at 10:00 a.m.
| State | June 2022(P) rate |
Rank |
|---|---|---|
|
Minnesota |
1.8 | 1 |
|
Nebraska |
1.9 | 2 |
|
New Hampshire |
2.0 | 3 |
|
Utah |
2.0 | 3 |
|
Vermont |
2.2 | 5 |
|
South Dakota |
2.3 | 6 |
|
Indiana |
2.4 | 7 |
|
Kansas |
2.4 | 7 |
|
Idaho |
2.5 | 9 |
|
North Dakota |
2.5 | 9 |
|
Alabama |
2.6 | 11 |
|
Iowa |
2.6 | 11 |
|
Montana |
2.6 | 11 |
|
Rhode Island |
2.7 | 14 |
|
Florida |
2.8 | 15 |
|
Missouri |
2.8 | 15 |
|
Virginia |
2.8 | 15 |
|
Georgia |
2.9 | 18 |
|
Oklahoma |
2.9 | 18 |
|
Wisconsin |
2.9 | 18 |
|
Maine |
3.0 | 21 |
|
Wyoming |
3.1 | 22 |
|
Arkansas |
3.2 | 23 |
|
South Carolina |
3.2 | 23 |
|
Arizona |
3.3 | 25 |
|
Tennessee |
3.3 | 25 |
|
Colorado |
3.4 | 27 |
|
North Carolina |
3.4 | 27 |
|
Oregon |
3.6 | 29 |
|
West Virginia |
3.6 | 29 |
|
Kentucky |
3.7 | 31 |
|
Massachusetts |
3.7 | 31 |
|
Louisiana |
3.8 | 33 |
|
Mississippi |
3.8 | 33 |
|
New Jersey |
3.9 | 35 |
|
Ohio |
3.9 | 35 |
|
Washington |
3.9 | 35 |
|
Connecticut |
4.0 | 38 |
|
Maryland |
4.0 | 38 |
|
Texas |
4.1 | 40 |
|
California |
4.2 | 41 |
|
Hawaii |
4.3 | 42 |
|
Michigan |
4.3 | 42 |
|
New York |
4.4 | 44 |
|
Delaware |
4.5 | 45 |
|
Illinois |
4.5 | 45 |
|
Pennsylvania |
4.5 | 45 |
|
Alaska |
4.6 | 48 |
|
Nevada |
4.7 | 49 |
|
New Mexico |
4.9 | 50 |
|
District of Columbia |
5.5 | 51 |
|
Footnotes |
||
|
Note: Rates shown are a percentage of the labor force. Data refer to place of residence. Estimates for the current month are subject to revision the following month. |
||
Last Modified Date: July 22, 2022
![]()