Vermont Business Magazine A new report by Zutobi an online driver's ed prep platform has ranked Vermont #1 out of the 50 states, for having the most readily available EV charging points. Vermont ranks 10th in the percent of EVs among all vehicles.
Vermont reportedly has 123.6 charging points as compared to the lowest state Louisiana with only 8.3 charging points. SEE TABLES BELOW
The report also details the states with the most and least number of EV charging points, information about the number of electric vehicles per states in the US, the number of registered EVs, the percentage of vehicles that are electric and an overall U.S. score of EVs.
The 2022 US Electric Vehicle Charging Point Report
The US is a vast country, with each state playing by its own rules to a certain extent and, with EVs relying heavily on a network of charging stations to operate effectively, there’s still a long way to go before the country is really ready for a large rollout of electric vehicles. We’ve crunched the numbers and looked at how well the different states are doing, which ones have the infrastructure, and how EV take up currently compares to other vehicles.
We’re also looking at how the numbers have changed since our last edition of the 2021 US Electric Vehicle Charging Point Report.
- The number of EVs in the US has increased by 87.5% since the last edition of the report, increasing from 543,610 to just over a million today.
- However, the growth in public charging outlets hasn’t quite matched that, growing from 98,422 to 128,554 over the same period, an increase of around 31%.
The number of chargers per 100 EVs in each state

The US states with the highest proportion of electric vehicles on the road
While the infrastructure is important, it’s also important to highlight that many states have a strong uptake in electric vehicles in comparison to the total number of vehicles on the road.
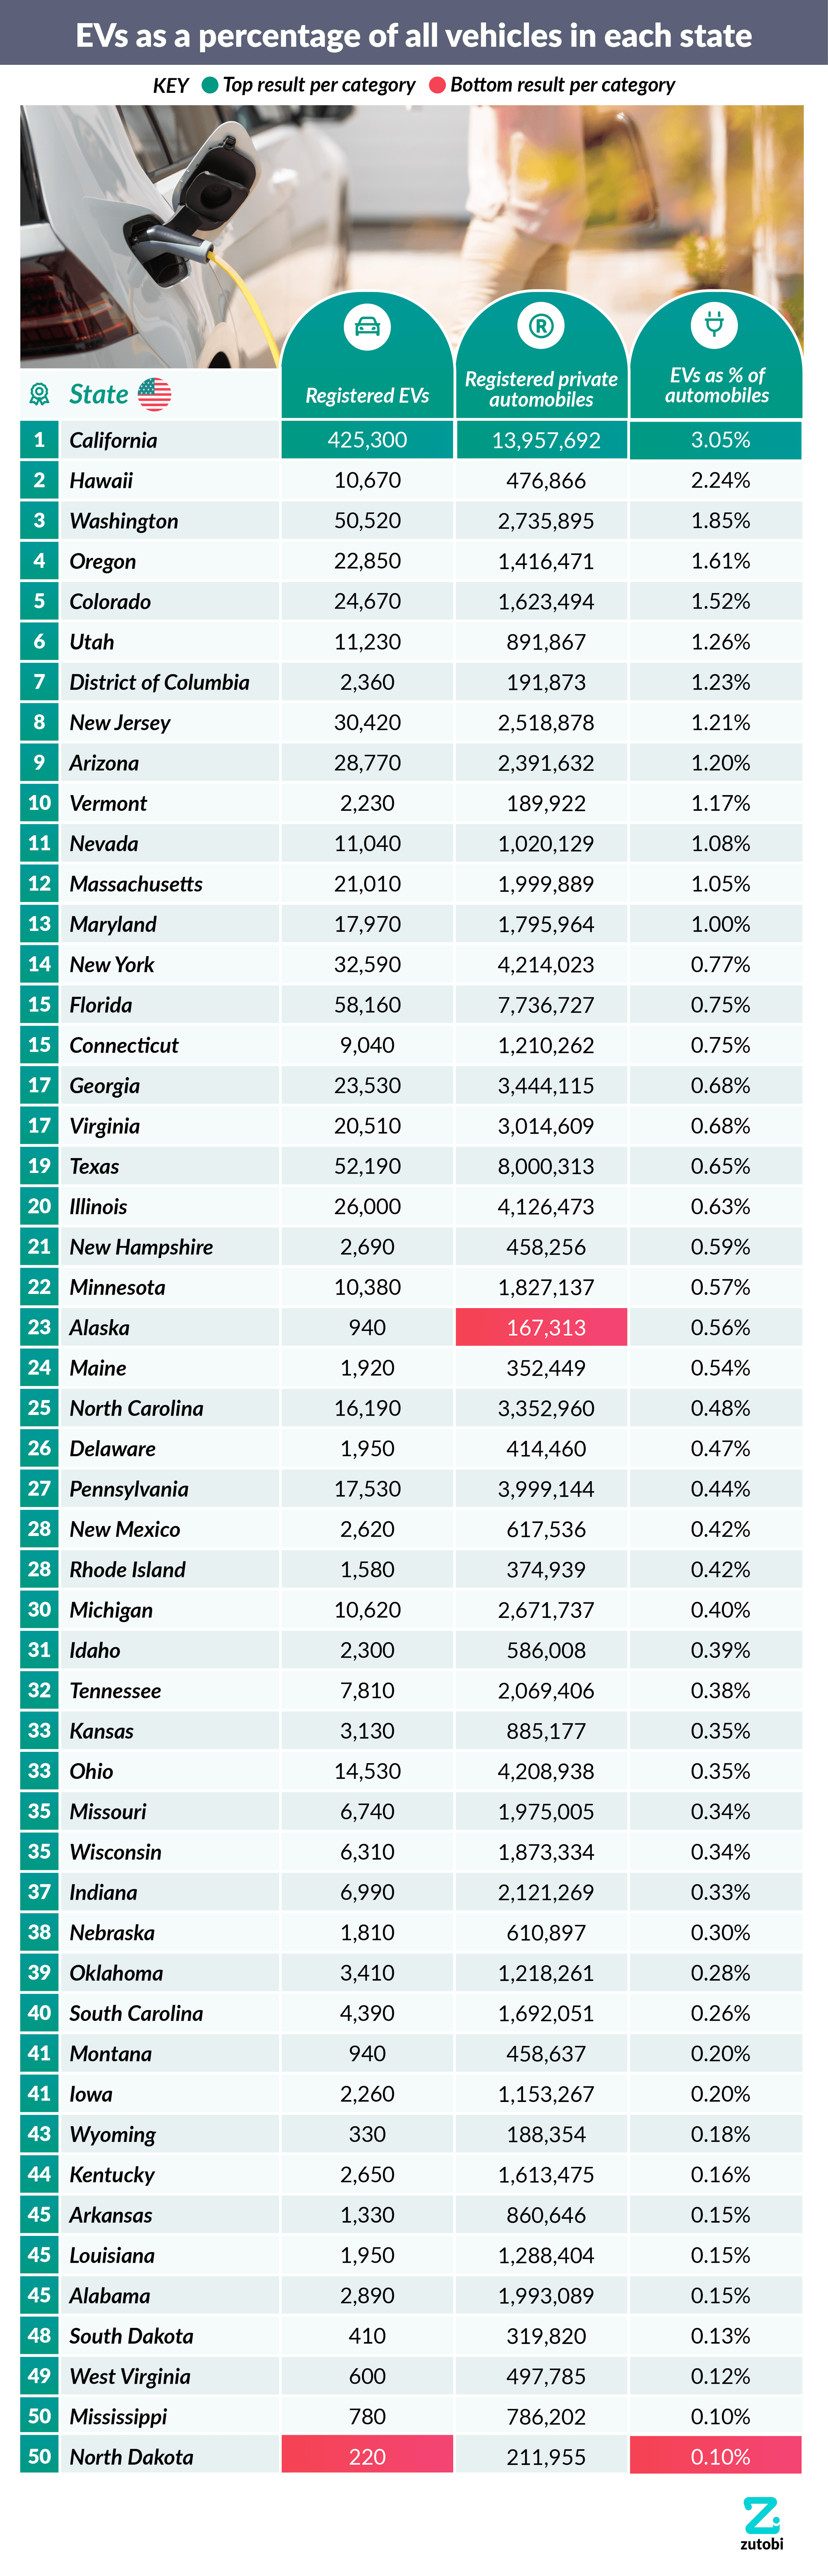
1. California
Registered EVs: 425,300
Registered private automobiles: 13,957,692
EVs as % of automobiles: 3.05%
No surprise here – despite its staggering number of private cars on the road, 13,957,692 to be exact, it also has by far the largest number of EVs, with 425,300, which equates to just over 3% of total cars being electric. California has long been at the forefront of EV adoption, with active support from the local government with a number of incentives, both financial and non-financial, such as a rebate of up to $2,500 and access to carpool and high-occupancy vehicle lanes.
2. Hawaii
Registered EVs: 10,670
Registered private automobiles: 476,866
EVs as % of automobiles: 2.24%
The island state of Hawaii may seem like a surprising place for an EV success story, but there are strong incentives, short driving distances, and a climate that lends itself to EV performance. This means it’s no real surprise that the island is seeing a strong uptake in EVs, with 10,670 electric vehicles on the roads, meaning 2.24% of cars on the road are EVs.
3. Washington
Registered EVs: 50,520
Registered private automobiles: 2,735,895
EVs as % of automobiles: 1.85%
Another state that has embraced the electric vehicle revolution is Washington, with 1.85% of vehicles being electric.
The state has taxes on gasoline sales and car license fees, although recently stopped short of passing a bill to require all cars sold in the state to be electric by 2030.
The US states with the lowest proportion of electric vehicles on the road
1. North Dakota & Mississippi
Registered EVs: 220/780
Registered private automobiles: 211,955/786,202
EVs as % of automobiles: 0.1%
A big part of the reason why North Dakota and Mississippi are amongst the states with the most chargers per electric vehicle is unfortunately that they haven’t experienced great uptake, with both having just 0.1% of all vehicles being electric.
And while the fact that both have a good number of chargers per vehicle is promising, both are somewhat lacking when it comes to financial incentives for drivers.
3. West Virginia
Registered EVs: 600
Registered private automobiles: 497,785
EVs as % of automobiles: 0.12%
Finally, West Virginia also has a poor uptake of electric vehicles, with a rate of just 0.12% of vehicles registered in the state being powered by electricity.
Again, this could largely be put down to a lack of incentives or exemptions from taxes, with EV drivers actually having to pay an annual fee of $200.
How have the numbers of EVs and charging points changed?
Since first taking a look at the EV charging landscape in the US, the numbers of both electric vehicles themselves and chargers have both continued to increase.
Following the 2020 election, the Biden administration announced that they expect 50% of all vehicles sold in the country to be electric by 2030 and the sale of fossil fuel vehicles banned by 2035, accomplished through purchase incentives, taxes and restrictions on internal combustion vehicles, new congestion charging zones and tougher emissions standards.
So, how have the figures changed since our last edition of the 2021 US Electric Vehicle Charging Point Report?
In total, the number of electric vehicles in the US has increased by 87.5% since the last edition of the report, growing from 543,610 to just over a million today.
However, the growth in public charging outlets hasn’t quite matched that, growing from 98,422 to 128,554 over the same period, an increase of around 31%.
While it’s encouraging that more people are choosing to buy electric vehicles, the speed at which chargers are installed clearly needs to improve alongside this, and could be set to do just that in the coming years, with the president promising to have 500,000 installed by 2030.
At state level, Delaware was the state that saw the biggest increase, not just in the number of EVs on the road (170.8%) but also when it came to chargers too (68.8%). This growth has been backed by a rebate program in the state, including $2,500 for battery electric vehicles and $1,000 for hybrids.
However, states where EV adoption is clearly struggling to gain traction include Oklahoma (3.6% increase in EVs) and Wyoming (9.5% increase in chargers).
EVs as a percentage of all vehicles in each state
Methodology
The number of charging outlets in each state was sourced from the Alternative Fuels Data Center’s Alternative Fueling Station Count by State, taking the number of electric EVSE ports in each state.
The number of electric vehicles in each state was sourced from the Alternative Fuels Data Center’s Electric Vehicle Registrations by State data and refers to the number of registered electric vehicles as of December 31, 2020.
The number of vehicles registered in each state was sourced from the Federal Highway Administration’s Highway Statistics 2020 and refers to the total number of private and commercial automobiles including taxicabs).
Who is behind this study?
Zutobi is an online driver’s education company with the goal to make the roads a safer place. Instead of just helping students prepare for the permit test, our top priority is to teach about driving safety practices and driver safety to create better, and safer, drivers.
Zutobi · Updated Feb 02, 2022