Vermont Business Magazine The Federal Emergency Management Agency (FEMA) is changing the way flood insurance is priced. Starting on October 1, 2021, FEMA will unveil Risk Rating 2.0. FEMA says Risk Rating 2.0 will transform the National Flood Insurance Program (NFIP) by bringing more equitable pricing to flood insurance. While Vermont has 3,330 policyholders with flood insurance (third fewest in the nation), about two-thirds of those will see a rate increase. There are over 5 million flood policies in the US, according to online insurance middleman QuoteWizard.
Under Risk Rating 2.0, the cost of flood insurance will be primarily based on the cost of replacing a home and each property's unique flood risk.
Risk Rating 2.0 will use five main variables to determine a property’s flood risk:
- Historical flood frequency
- Flood type: river, rainfall, coastal surge, coastal erosion
- Distance to water source
- Property characteristics: elevation, soil, etc.
- Cost to rebuild
Risk Rating 2.0 will significantly change what millions of Americans pay for flood insurance. More than 5 million people are currently insured through the NFIP. Nearly 80% of those policyholders will immediately pay $10-$100 more a month. Around 1.2 million policyholders will immediately see a rate decrease of between $10 and $100 a month. We found that for the most part, property owners in lower-value homes and neighborhoods will be paying less, while property owners in higher-value homes and neighborhoods will be paying more.
| State | % of policies with an increase | % of policies with a decrease | % of policies that will increase by $20 or more | % of policies that will decrease by $20 or more | % of policies that will increase by $60 or more | % of policies that will decrease by $20 or more | Total policies affected |
|---|---|---|---|---|---|---|---|
| Alabama | 79% | 21% | 3% | 9% | 0.2% | 6% | 52,648 |
| Alaska | 14% | 86% | 1% | 47% | 0.1% | 21% | 2,250 |
| Arizona | 75% | 25% | 2% | 16% | 0.1% | 9% | 29,261 |
| Arkansas | 67% | 33% | 4% | 23% | 0.2% | 13% | 14,397 |
| California | 73% | 27% | 4% | 16% | 0.1% | 9% | 214,829 |
| Colorado | 57% | 43% | 4% | 20% | 0.2% | 12% | 19,983 |
| Connecticut | 63% | 37% | 9% | 26% | 0.7% | 17% | 34,828 |
| Delaware | 62% | 38% | 2% | 16% | 0.1% | 7% | 26,147 |
| Florida | 80% | 20% | 4% | 5% | 0.2% | 2% | 1,727,811 |
| Georgia | 76% | 24% | 2% | 11% | 0.1% | 7% | 81,998 |
| Hawaii | 87% | 13% | 4% | 7% | 0.3% | 5% | 61,382 |
| Idaho | 72% | 28% | 3% | 16% | 0.1% | 9% | 5,645 |
| Illinois | 58% | 42% | 4% | 28% | 0.4% | 16% | 37,677 |
| Indiana | 54% | 46% | 3% | 32% | 0.1% | 19% | 20,081 |
| Iowa | 63% | 37% | 6% | 24% | 0.7% | 14% | 12,637 |
| Kansas | 62% | 38% | 3% | 24% | 0.2% | 14% | 9,565 |
| Kentucky | 71% | 29% | 6% | 19% | 0.5% | 10% | 19,361 |
| Louisiana | 80% | 20% | 3% | 12% | 0.1% | 7% | 495,923 |
| Maine | 66% | 34% | 9% | 16% | 0.8% | 11% | 7,746 |
| Maryland | 39% | 61% | 1% | 15% | 0.1% | 8% | 64,942 |
| Massachusetts | 61% | 39% | 6% | 24% | 0.5% | 16% | 58,501 |
| Michigan | 46% | 54% | 1% | 34% | 0.1% | 21% | 20,481 |
| Minnesota | 71% | 29% | 3% | 15% | 0.2% | 10% | 10,541 |
| Mississippi | 84% | 16% | 4% | 11% | 0.3% | 6% | 61,317 |
| Missouri | 70% | 30% | 7% | 19% | 0.7% | 12% | 19,706 |
| Montana | 63% | 37% | 2% | 21% | 0.1% | 13% | 4,339 |
| Nebraska | 57% | 43% | 7% | 32% | 0.2% | 19% | 9,129 |
| Nevada | 79% | 21% | 3% | 14% | 0.3% | 9% | 10,586 |
| New Hampshire | 65% | 35% | 7% | 22% | 0.5% | 10% | 7,747 |
| New Jersey | 79% | 21% | 5% | 13% | 0.4% | 8% | 217,178 |
| New Mexico | 64% | 36% | 2% | 25% | 0.1% | 13% | 11,556 |
| New York | 68% | 32% | 7% | 18% | 0.5% | 13% | 171,099 |
| North Carolina | 74% | 26% | 3% | 12% | 0.2% | 8% | 139,842 |
| North Dakota | 62% | 38% | 1% | 15% | 0.1% | 7% | 13,161 |
| Ohio | 55% | 45% | 4% | 28% | 0.4% | 18% | 29,044 |
| Oklahoma | 70% | 30% | 4% | 20% | 0.1% | 12% | 13,024 |
| Oregon | 70% | 30% | 4% | 17% | 0.2% | 11% | 24,850 |
| Pennsylvania | 70% | 30% | 7% | 19% | 0.8% | 13% | 51,555 |
| Rhode Island | 54% | 46% | 3% | 29% | 0.3% | 22% | 12,001 |
| South Carolina | 74% | 26% | 3% | 10% | 0.2% | 5% | 208,559 |
| South Dakota | 69% | 31% | 4% | 21% | 0.2% | 15% | 3,743 |
| Tennessee | 72% | 28% | 5% | 15% | 0.4% | 9% | 27,507 |
| Texas | 86% | 14% | 3% | 8% | 0.1% | 4% | 768,537 |
| Utah | 47% | 53% | 1% | 18% | 0.1% | 10% | 3,755 |
| Vermont | 67% | 33% | 8% | 23% | 1.0% | 17% | 3,330 |
| Virginia | 55% | 45% | 2% | 17% | 0.1% | 9% | 104,781 |
| Washington | 67% | 33% | 4% | 20% | 0.2% | 12% | 32,547 |
| West Virginia | 83% | 17% | 8% | 13% | 1.0% | 8% | 13,337 |
| Wisconsin | 56% | 44% | 2% | 27% | 0.1% | 17% | 12,949 |
| Wyoming | 67% | 33% | 3% | 22% | 0.2% | 15% | 1,705 |
| United States | 77% | 23% | 4% | 11% | 0.2% | 6% | 5,017,534 |
| Source: Federal Emergency Management Agency data | |||||||
Hide rows
Our team of analysts found that Hawaii, Texas and Mississippi have the highest percentages of policyholders who will see a price increase. Meanwhile, more than 50% of policyholders in Alaska, Michigan, Maryland and Utah will see a price decrease.
West Virginia, Maine and Connecticut have the largest percentages of policyholders who will see a price decrease of $20 or more, while Rhode Island has the largest percentage of policyholders who will experience a price decrease of $60 or more.
Florida has the largest number of policyholders that will see a major change: Nearly 22,000 Floridians will see the cost of their flood insurance drop by $100 or more, and 1,200 people will see it increase by $100 or more.
Risk Rating 2.0 will go into effect for new policyholders starting on October 1, 2021, and for existing policyholders starting on April 1, 2022.
Total flood insurance losses paid by the NFIP by state in 2021
In 2021, the total amount of payments of all claims amounted to over $71 billion. That's a lot of coverage compared to how affordable flood insurance can be in high-risk areas. Here's how much money NFIP flood insurance policies have paid out by state.
| State | Money policies have paid out |
|---|---|
| Alabama | $1,154,473,233 |
| Alaska | $10,347,335 |
| Arizona | $52,902,161 |
| Arkansas | $189,346,884 |
| California | $630,777,308 |
| Colorado | $88,317,292 |
| Connecticut | $513,596,048 |
| Delaware | $82,031,304 |
| District of Columbia | $4,635,111 |
| Florida | $5,778,152,149 |
| Georgia | $448,063,490 |
View all rows
Worst loss years 1998-2018
The NFIP paid out over $58 billion in flood relief between 1998 and 2018. The graph below shows the cost of claims paid in millions.
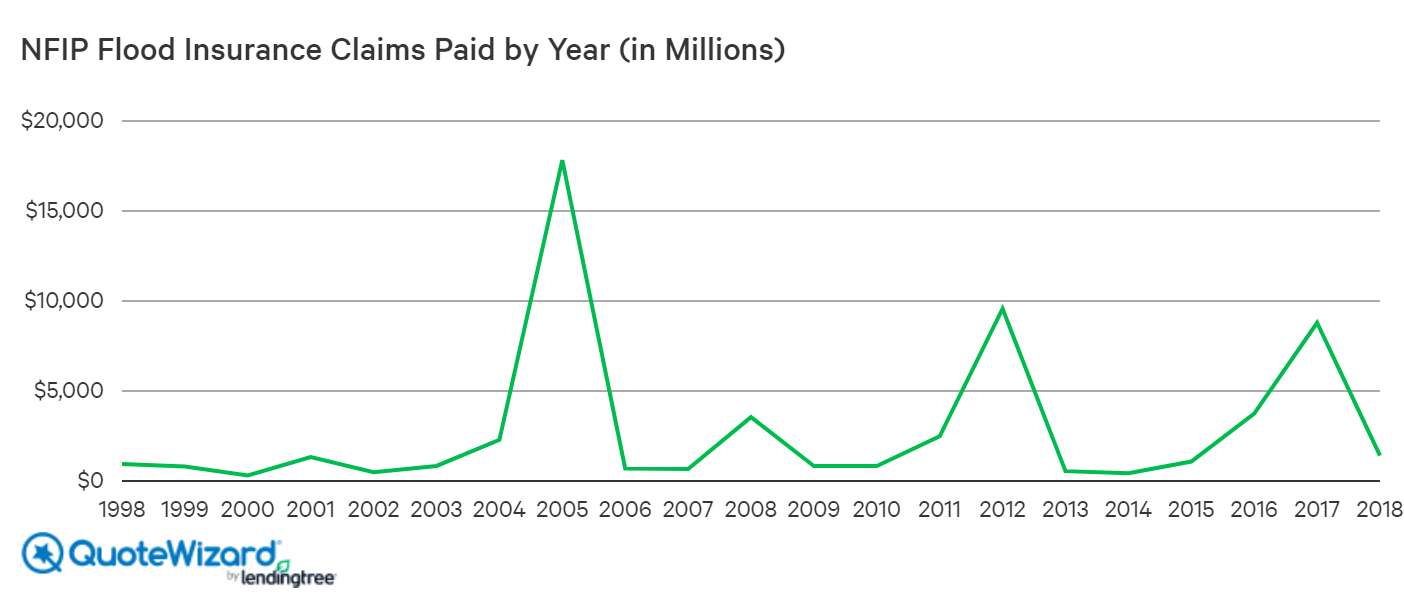
As you can see, there are major spikes in 2005, 2012 and 2017 for Hurricane Katrina, Superstorm Sandy and Hurricane Harvey, respectively. Those three loss years alone account for 62% of all paid claims between 1998 and 2018. So, while most years you won't need to make a claim on your flood insurance policy, it can come in handy when a large catastrophe hits.
The rise of private flood insurance
Recent years have seen enormous growth in the number of private flood insurance policies. Some folks may pay more through the NFIP than they would through a private flood insurance company, which is one of the causes of the growth. Therefore, you shouldn't assume that the NFIP is your only option. As is the case with all insurance products, shopping around and considering every option available to you will ensure you get the right coverage at a reasonable rate.
Private flood insurance companies use more sophisticated mapping techniques than FEMA to determine flood risk. Therefore, there are some places that FEMA designates as higher risk than they are. This is one of the reasons you may be able to save with a private flood insurance policy.
The U.S. government is encouraging the growth of the private flood insurance market because the NFIP is over $20.5 billion in debt as of January 2018. This is because the amount of premiums collected through the program do not cover the costs needed to pay out for disasters. The purpose of the NFIP at its founding in 1968 was to provide flood insurance to people who couldn't get protection through a private company. Now, the U.S. government is becoming less willing to foot the bill and is looking more and more to private flood insurance companies.
Frequently asked questions
Q: How much does flood insurance cost?
A: The average cost of flood insurance is $958 a year, according to our study. However, rates vary depending on a number of factors.
Q: Is flood insurance required?
A: Flood insurance is required by the government if you live in a Special Flood Hazard Area (SFHA). Your mortgage lender can also require flood insurance as a condition of your loan.
Q: Does homeowners insurance cover flood?
A: No, homeowners insurance does not usually protect you from floods. Flood insurance is a separate, stand-alone policy.
Q: Should I get flood insurance?
A: We recommend every homeowner purchase flood insurance, even if it isn't required. Floods can cause severe damage to your home and belongings.
Methodology:
We sourced our data exclusively through government agencies. The rate and loss data came from FEMA, and the demographic data from the U.S. Census Bureau. The minimum and maximum costs of flood insurance in SFHAs were calculated using the NFIP's publicly available rate tables.
References:
QuoteWizard.com LLC has made every effort to ensure that the information on this site is correct, but we cannot guarantee that it is free of inaccuracies, errors, or omissions. All content and services provided on or through this site are provided "as is" and "as available" for use. QuoteWizard.com LLC makes no representations or warranties of any kind, express or implied, as to the operation of this site or to the information, content, materials, or products included on this site. You expressly agree that your use of this site is at your sole risk.
Source: QuoteWizard by LendingTree, LLC. Seattle. 9.23.2021. QuoteWizard provides end-to-end solutions for insurance shoppers and agents.