Vermont Business Magazine The Vermont State employee health plan covers more than 25,000 members and works like ordering from an a la carte menu. Each time someone receives a medical service, the state pays a site-specific price. When a state employee uses (often without knowing it) a more expensive provider, it increases the overall cost of health care for the state, which is mostly paid for by taxpayers.
This report, released Friday by Vermont Auditor of Accounts Doug Hoffer, examines the extent to which the state is paying different prices to different medical providers for the exact same services.
The term used to describe this is “price variation.”
Examining a sample of health care services commonly used by state employees, the auditor found that the highest priced provider for a given service was paid an average of 3.5 times more than the lowest priced provider for the exact same service.
The most extreme difference in prices is for echocardiographs – the highest priced provider is paid 9.3 times more than the lowest priced.
Utilization of higher priced providers – and the resulting increase in health care spending – matters because state employee health care is a significant and growing expense for Vermont.
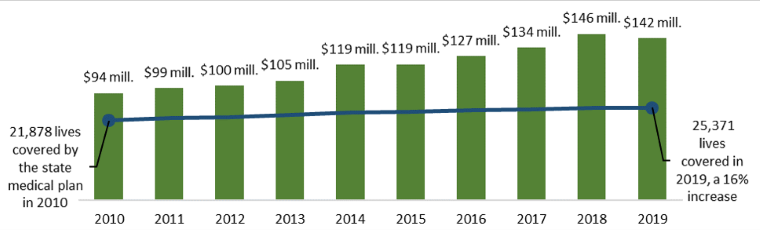
From 2010 to 2019, annual medical payments for state employees, retirees, and their families increased by 51%, from $94 million to $142 million. That’s a combined $245 million in increased payments.
Reducing the cost of health care would free up resources that could support other state efforts or ease the pressure on taxpayers.
In response, the auditor examined two strategies Vermont could pursue to reduce the cost of state employee health care by addressing price variation.
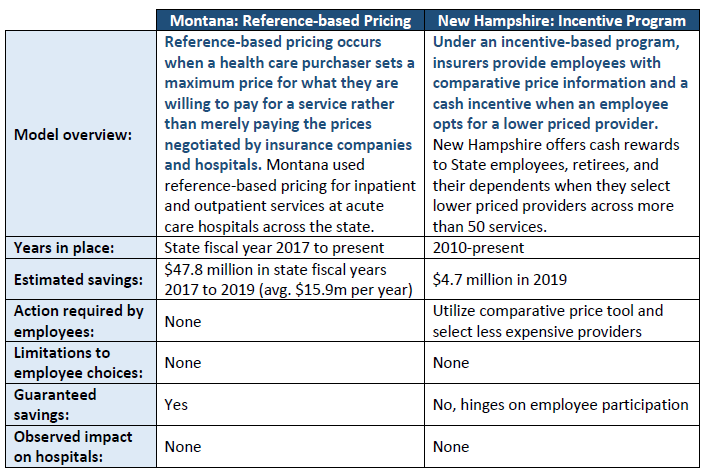
1) Reference-based pricing: Reference-based pricing occurs when a health care purchaser, in this case a state, sets a maximum amount they are willing to pay for a service rather than merely paying the prices negotiated by insurance companies and hospitals. The auditor estimates that if reference-based pricing was implemented for just the 39 services they sampled, savings could reach $2.3 million annually, with an average savings of 13% per service. If this level of savings was achieved across all services, total savings could reach $16.3 million annually.
2) Incentives to select cost-effective care: Under this model, insurers provide employees with comparative price information and a cash incentive when an employee selects a lower priced provider. The auditor estimates that if the state implemented this program for seven types of shoppable services in their sample, savings could reach approximately $202,000 annually, with an average of 3% savings per service; with each added service (there are hundreds), the state would enjoy additional savings.
Auditor's Narrative
Imagine that you are purchasing a new car. Two dealers in your town are selling the car that you want, but one of them is charging 50% more. You wouldn’t choose the more expensive dealer, right? And yet, in health care, Vermonters frequently select (often without knowing it) the more expensive option, using providers that charge double, triple, or more for the exact same procedure.
For a number of reasons, health care does not operate like other markets, and patients may not be able or incentivized to seek out a better deal. But when patients use more expensive providers, it increases the cost of health care for patients and employers.

This report examines the extent to which the Vermont State employee health plan pays different prices to different medical providers for the exact same service. The term used to describe this is “price variation.” We then examine two strategies Vermont could pursue to reduce health care costs by addressing price variation.
The State pays significantly different prices for the same health care services used by State employees
The State health plan covers more than 25,000 employees, retirees, and dependents. Each time someone covered by the plan receives a medical service, the State pays a pre-arranged price that is site-specific. We found significant variation in prices paid by the State for health care services frequently used by State employees.
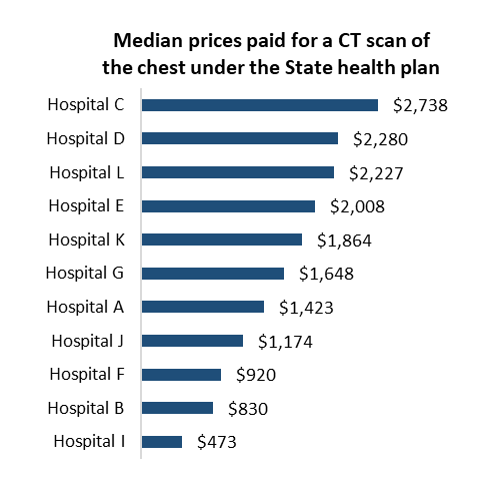
In our sample, the highest priced provider for a given service was paid an average of 3.5 times more than the lowest priced provider for the same service. For some services, the difference between the highest and lowest priced provider was even more extreme, such as a CT scan (5.8 times) and an echocardiograph (9.3 times).
When State employees use more expensive care, it increases the total cost of care and ultimately the taxpayers pay more. In our sample, State employees used higher priced providers for approximately 40% of services.
Utilization of higher cost providers – and the resulting increase in health care spending – matters because State employee health care is a significant and growing expense.
Between 2010 and 2019, annual medical payments covered by the State plan grew 51%, from $94 million to $142 million, while the number of covered lives grew by just 16%. Reducing the cost of employees’ health care would free up resources to support other State efforts or ease the pressure on taxpayers.
Other states have successfully reduced the cost of their employees’ health care by controlling price variation
Many states are grappling with the rising costs of their employee health plans. Some states, including Montana and New Hampshire, have implemented innovative policies to reduce the cost of care for their employees by limiting price variation:
Implementing similar approaches in Vermont’s State employee plan could result in significant savings
Drawing on the examples from Montana and New Hampshire, we used price data from the Vermont State health plan to estimate potential savings if Vermont implemented similar programs.
Reference-based Pricing
We estimate that if reference-based pricing using the midpoint price was implemented for just the 39 services we sampled, the State could save $2.3 million annually, with an average of 13% savings per service.
If this level of savings was achieved across all services, total savings could reach $16.3 million annually.
For example, in our sample, the State plan covered 366 CT scans of the abdomen or pelvis in 2019, at a total cost exceeding $1 million. Of the 366 visits, 240 (two-thirds) took place at hospitals that were above the midpoint price.
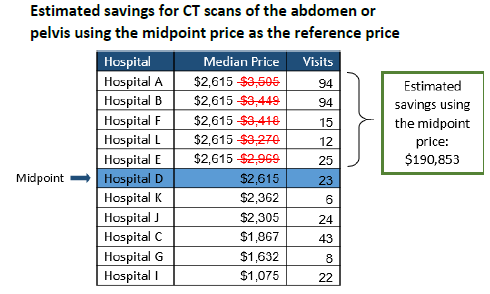
If Vermont capped the price for CT scans at the midpoint price, we estimate annual savings of approximately $191,000, or 18% of the total cost for just this one service.
Incentive Program
We also modeled potential savings if Vermont offered an incentive for employees to select lower priced care (at the midpoint price or below).
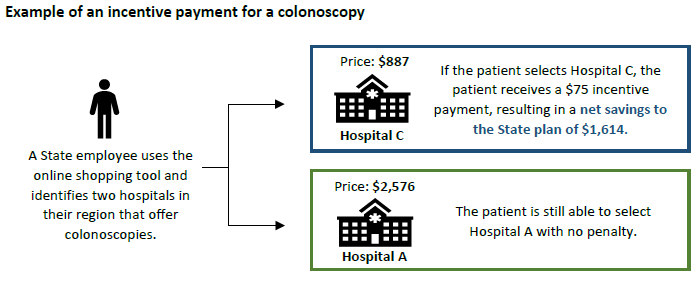
We estimated savings for seven types of “shoppable” services, meaning services that patients can schedule in advance. If an incentive program resulted in one third of more expensive services moving to the midpoint price, savings for just these seven types of services could reach approximately $202,000 annually, with an average of 3% savings per service; with each added service (there are hundreds), the State would enjoy additional savings.
Example of an incentive payment for a colonoscopy
Investigative Report: An investigative report is a tool used to inform citizens, policymakers, and State agencies about issues that merit attention. It is not an audit and is not conducted under generally accepted government auditing standards. Unlike an audit, which contains formal recommendations, investigative reports include information and possible risk-mitigation strategies relevant to the topic that is the object of the inquiry.
Principal Investigator: Fran Hodgins, Government Research Analyst
Source: Auditor of Accounts. Montpelier 11.12.2021 www.auditor.vermont.gov