Vermont Business Magazine The Vermont Department of Labor on March 15 announced that the January 2021 unemployment rate was 3.2 percent. This reflects a decrease of three-tenths of one percentage point from the prior month’s upwardly revised estimate of 3.5 percent. The comparable United States rate in January was 6.3 percent, which was a decrease of four-tenths of one percentage point from the revised December estimate. Vermont's jobless rate is tied for third lowest in the nation with Nebraska. North Dakota and Utah are at 3.1 percent. Hawaii has the highest rate at 10.2 percent.
“With the release of the January 2021 data, the Department is also announcing the annual release of updated previous year data. Based on the revised 2020 data, we see the state peaked at a 14.8% unemployment rate in April 2020,” said Michael Harrington, Labor Commissioner. “Overall, the calendar year unemployment rate was 5.6% which matched the 2011 level coming out of the last recession.”
Since last year, Vermont employers have nearly 30,000 fewer filled positions on payroll.
However, based on early news about the vaccine, the Department is optimistic that the state will start to experience significant economic recovery in 2021.
Harrington said the Department is here to assist Vermont companies with their recruitment efforts, as well as job seekers looking for their next career or training opportunity.”
State of Vermont Overview
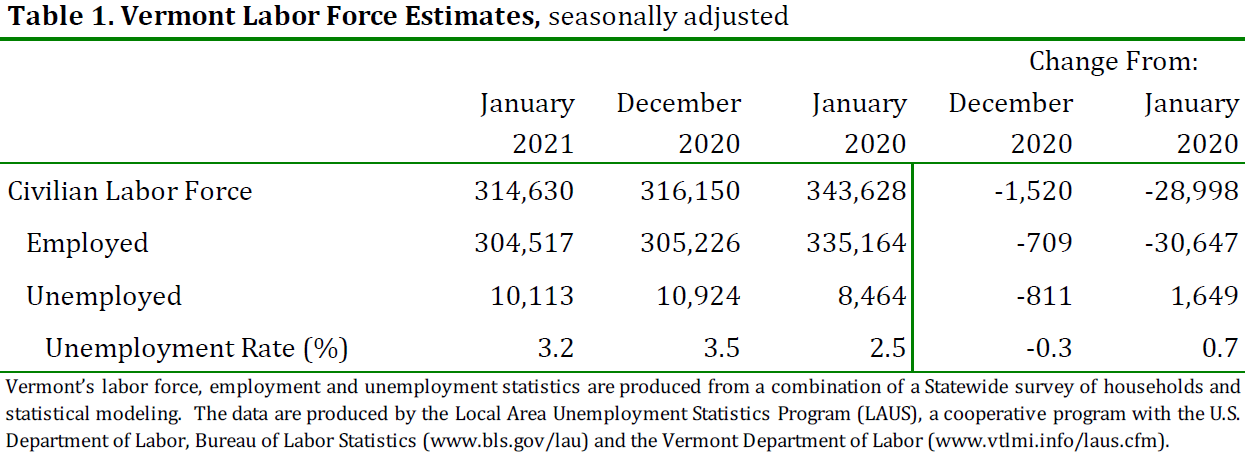
The seasonally-adjusted Vermont data for January show the Vermont civilian labor force decreased by 1,520 from the prior month’s revised estimate (see Table 1). The number of employed persons decreased by 709 and the number of unemployed persons decreased by 811. The changes to the labor force, the number of unemployed persons and the unemployment rate were statistically significant in the seasonally-adjusted series.
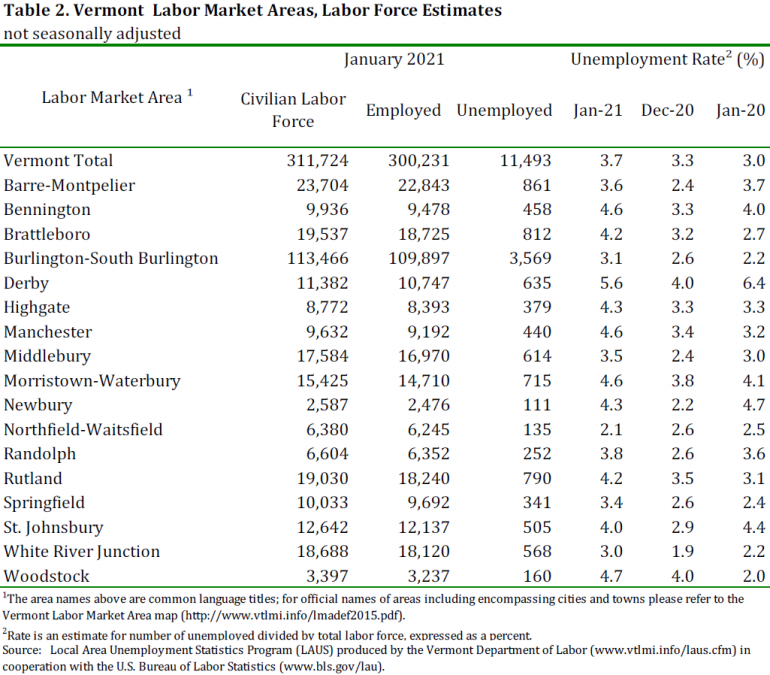
The January unemployment rates for Vermont’s 17 labor market areas ranged from 2.1 percent in Northfield-Waitsfield to 5.6 percent in Derby (note: local labor market area unemployment rates are not seasonally-adjusted – see Table 2). For comparison, the January unadjusted unemployment rate for Vermont was 3.7 percent, which was an increase of four-tenths of one percentage point from the revised unadjusted December level and an increase of seven-tenths of one percentage point from a year ago. Analysis of Job Changes by Industry
Seasonally-Adjusted (Table 3)
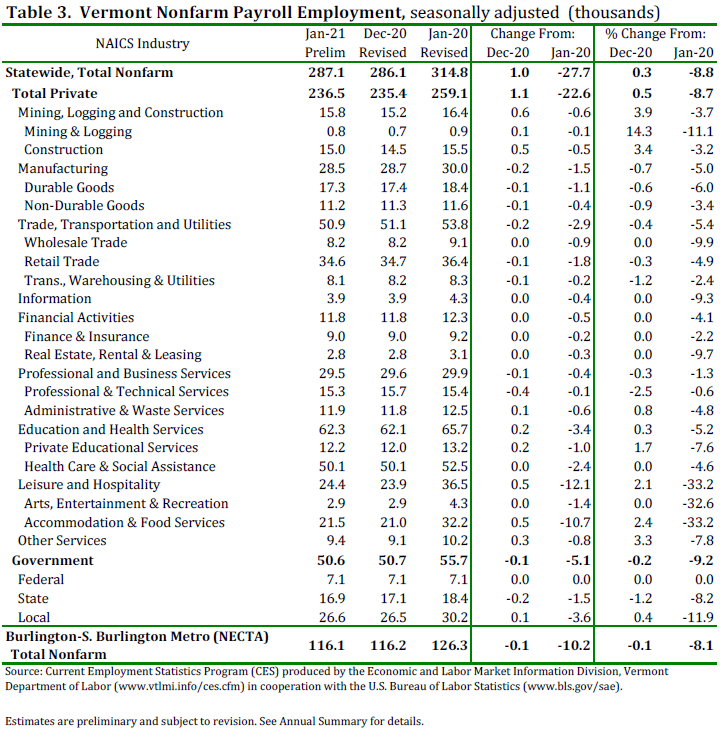
The seasonally-adjusted data for January reports an increase of 1,000 jobs from the revised December data. There was a decrease of 500 jobs between the preliminary and the revised December estimates due to the inclusion of more data. The seasonally-adjusted over-the-month changes in January varied at the industry level. Those with a notable increase include: Construction (+500 jobs or +3.4%), Accommodation & Food Services (+500 jobs or +2.4%) and Other Services (+300 jobs or +3.3%). Industries with a notable decrease include: Transportation, Warehousing & Utilities (-100 jobs or -1.2%), Professional and Technical Services (-400 jobs or -2.5%) and State Government (-200 jobs or -1.2%).
Not-Seasonally-Adjusted (Table 4)
The preliminary ‘not-seasonally-adjusted’ jobs estimates for January show a decrease of 7,600 jobs when compared to the revised December numbers. As with the ‘seasonally-adjusted’ data, this over-the-month change is from the revised December numbers which experienced an increase of 300 jobs from the preliminary estimates. The broader economic picture can be seen by focusing on the over-the-year changes in this data series. As detailed in the preliminary ‘not-seasonally-adjusted’ January data, Total Private industries have decreased by 23,000 jobs (-8.9%) and Government (including public education) employment has decreased by 4,800 jobs (-8.6%) in the past year.
The unemployment rate is based on household data.

| State | January 2021(P) rate |
Rank |
|---|---|---|
|
South Dakota |
3.1 | 1 |
|
Utah |
3.1 | 1 |
|
Nebraska |
3.2 | 3 |
|
Vermont |
3.2 | 3 |
|
Idaho |
3.4 | 5 |
|
Iowa |
3.5 | 6 |
|
Kansas |
3.5 | 6 |
|
New Hampshire |
3.6 | 8 |
|
Wisconsin |
3.8 | 9 |
|
Montana |
4.0 | 10 |
|
Indiana |
4.2 | 11 |
|
Alabama |
4.3 | 12 |
|
Missouri |
4.3 | 12 |
|
Oklahoma |
4.3 | 12 |
|
Minnesota |
4.5 | 15 |
|
North Dakota |
4.5 | 15 |
|
Arkansas |
4.6 | 17 |
|
Florida |
4.8 | 18 |
|
Georgia |
5.1 | 19 |
|
Tennessee |
5.1 | 19 |
|
Wyoming |
5.1 | 19 |
|
Maine |
5.2 | 22 |
|
Kentucky |
5.3 | 23 |
|
Ohio |
5.3 | 23 |
|
South Carolina |
5.3 | 23 |
|
Virginia |
5.3 | 23 |
|
Michigan |
5.7 | 27 |
|
North Carolina |
5.9 | 28 |
|
Delaware |
6.0 | 29 |
|
Washington |
6.0 | 29 |
|
Oregon |
6.2 | 31 |
|
Maryland |
6.4 | 32 |
|
Mississippi |
6.4 | 32 |
|
West Virginia |
6.5 | 34 |
|
Alaska |
6.6 | 35 |
|
Colorado |
6.6 | 35 |
|
Arizona |
6.7 | 37 |
|
Texas |
6.8 | 38 |
|
Rhode Island |
7.2 | 39 |
|
Pennsylvania |
7.3 | 40 |
|
Louisiana |
7.6 | 41 |
|
Illinois |
7.7 | 42 |
|
Massachusetts |
7.8 | 43 |
|
New Jersey |
7.9 | 44 |
|
Connecticut |
8.1 | 45 |
|
Nevada |
8.1 | 45 |
|
District Of Columbia |
8.4 | 47 |
|
New Mexico |
8.7 | 48 |
|
New York |
8.8 | 49 |
|
California |
9.0 | 50 |
|
Hawaii |
10.2 | 51 |
|
Footnotes |
||
|
Note: Rates shown are a percentage of the labor force. Data refer to place of residence. Estimates for the current month are subject to revision the following month. |
||
Last Modified Date: March 15, 2021
__________________________________________________________________________________________________________________
The Unemployment and Jobs Report for February is scheduled to be released on Friday, March 26, 2021 at 10:00 a.m.