by Timothy McQuiston, Vermont Business Magazine The Vermont unemployment rate fell steeply in October as both the number of employed went up as the number of unemployed went down. That is tempered again, however, by another decline in the labor force.
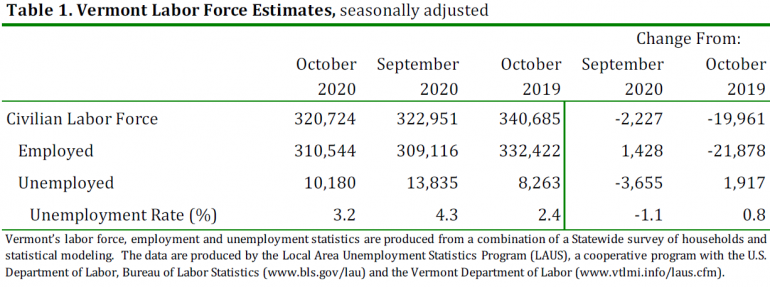
Today, the Vermont Department of Labor released data on the Vermont economy for October 2020. According to household data, the seasonally-adjusted statewide unemployment rate for October was 3.2 percent.
This reflects a decrease of one and one tenth percentage points from the prior month’s revised estimate of 4.3 percent. The comparable United States rate in October was 6.9 percent, a decrease of one percentage point from the revised September estimate.
Vermont has the second lowest rate in the nation behind Nebraska (3.0 percent). New Hampshire ranks sixth (4.2 percent).
Vermont's pre-pandemic March unemployment rate was 3.1 percent.
The October rate likely portrays a rosier economic picture than what actually exists.
Labor Commissioner Michael Harrington said at the press briefing held by Governor Scott today that the real unemployment rate is more in the 5 percent range, and if it included the PUA (Pandemic Unemployment Assistance for self-employed etc), the rate is likely more in the 6-8 percent range.
Harrington and the governor question the methodology used by the US Census. While they are using consistent data, they are not taking into account the new reality of the pandemic and accounting for why people are not looking for work, which could include health concerns, the need to care for family members and how the pandemic has hit some industries much harder than others.
Labor Commissioner Michael Harrington said: “The October data released today shows a slight decrease in the number of Vermonters who are currently filing for benefits; however, we know there are still a significant number of workers who are impacted by this Pandemic. The good news is that, while COVID transmission numbers are on the rise, there does not seem to be any significant correlation between the spread of the virus and worksite operations at this time. It is important to note that with the change in weather and the construction season coming to a close, the Department is anticipating a slight increase in new claims over the months of November and December. Finally, I urge all Vermonters to heed the guidance of the Governor and Dr. Levine, to redouble our efforts to minimize the spread of the virus. Now is the time for us to put the health and wellbeing of others before our own interests.”
The seasonally-adjusted Vermont data for October show the Vermont civilian labor force decreased by 2,227 from the prior month’s revised estimate. The number of employed persons increased by 1,428 and the number of unemployed persons decreased by 3,655. The changes to the number of unemployed persons and the unemployment rate were statistically significant in the seasonally-adjusted series.
Labor Markets
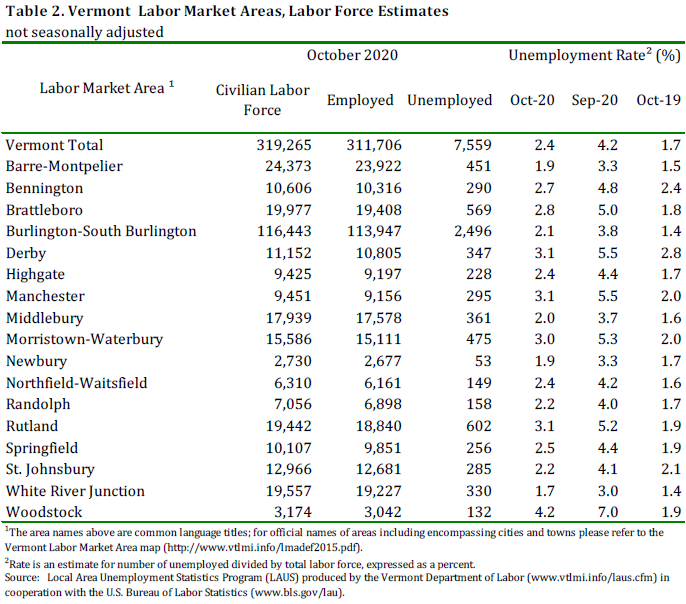
The October unemployment rates for Vermont’s 17 labor market areas ranged from 1.7 percent in White River Junction to 4.2 percent in Woodstock (note: local labor market area unemployment rates are not seasonally-adjusted). For comparison, the October unadjusted unemployment rate for Vermont was 2.4 percent, which was a decrease of one and eight-tenths percentage points from the revised unadjusted September level and an increase of seven-tenths of one percentage point from a year ago.
Not-Seasonally-Adjusted
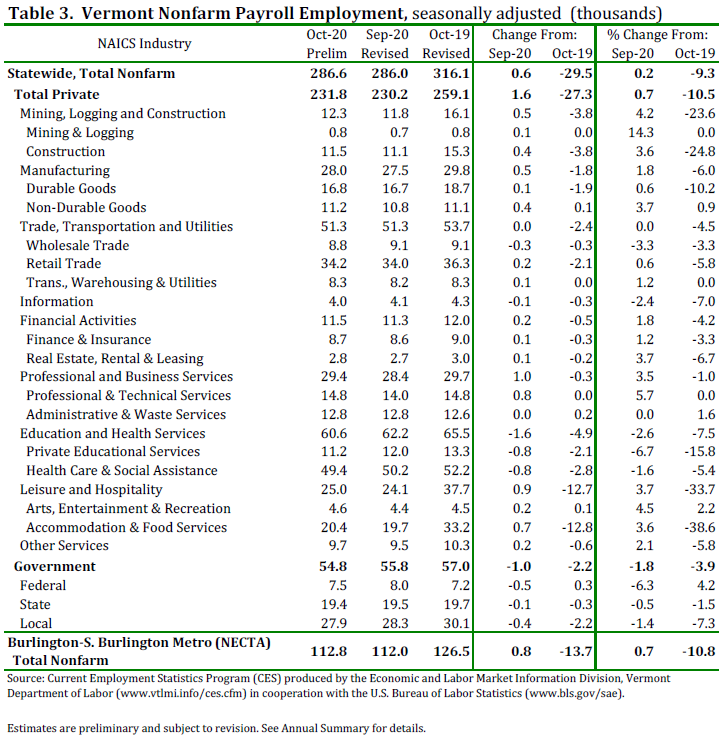
The preliminary ‘not-seasonally-adjusted’ jobs estimates for October show an increase of 3,400 jobs when compared to the revised September numbers. There was an increase of 900 jobs between the preliminary and the revised September estimates due to the inclusion of more data. The broader economic picture can be seen by focusing on the over-the-year changes in this data series. As detailed in the preliminary ‘not-seasonally-adjusted’ October data, Total Private industries have decreased by 27,800 jobs (-10.7 percent) and Government (including public education) employment has decreased by 2,500 jobs (-4.2 percent) in the past year.
Seasonally-Adjusted
The seasonally-adjusted data for October reports an increase of 600 jobs from the revised September data. As with the ‘not-seasonally-adjusted’ data, this over-the-month change is from the revised September numbers which experienced an increase of 1,000 jobs from the preliminary estimates. The seasonally-adjusted over-the-month changes in October varied at the industry level. Those with a notable increase include: Professional & Technical Services (+800 jobs or +5.7%), Arts, Entertainment & Recreation (+200 jobs or +4.5%), and Construction (+400 jobs or +3.6%). Industries with a notable decrease include: Private Educational Services (-800 jobs or -6.7%), Federal Government (-500 jobs or -6.3%), and Wholesale Trade (-300 jobs or -3.3%).
The Unemployment and Jobs Report for November is scheduled to be released on Friday, December 18, 2020 at 10:00 a.m.
| State | October 2020(P) rate |
Rank |
|---|---|---|
|
Nebraska |
3.0 | 1 |
|
Vermont |
3.2 | 2 |
|
Iowa |
3.6 | 3 |
|
South Dakota |
3.6 | 3 |
|
Utah |
4.1 | 5 |
|
New Hampshire |
4.2 | 6 |
|
South Carolina |
4.2 | 6 |
|
Georgia |
4.5 | 8 |
|
Minnesota |
4.6 | 9 |
|
Missouri |
4.6 | 9 |
|
North Dakota |
4.8 | 11 |
|
Montana |
4.9 | 12 |
|
Indiana |
5.0 | 13 |
|
Kansas |
5.3 | 14 |
|
Virginia |
5.3 | 14 |
|
Maine |
5.4 | 16 |
|
Idaho |
5.5 | 17 |
|
Michigan |
5.5 | 17 |
|
Wyoming |
5.5 | 17 |
|
Delaware |
5.6 | 20 |
|
Ohio |
5.6 | 20 |
|
Wisconsin |
5.7 | 22 |
|
Alabama |
5.8 | 23 |
|
Alaska |
5.9 | 24 |
|
Washington |
6.0 | 25 |
|
Connecticut |
6.1 | 26 |
|
Oklahoma |
6.1 | 26 |
|
Arkansas |
6.2 | 28 |
|
North Carolina |
6.3 | 29 |
|
Colorado |
6.4 | 30 |
|
West Virginia |
6.4 | 30 |
|
Florida |
6.5 | 32 |
|
Illinois |
6.8 | 33 |
|
Oregon |
6.9 | 34 |
|
Texas |
6.9 | 34 |
|
Rhode Island |
7.0 | 36 |
|
Pennsylvania |
7.3 | 37 |
|
Kentucky |
7.4 | 38 |
|
Massachusetts |
7.4 | 38 |
|
Mississippi |
7.4 | 38 |
|
Tennessee |
7.4 | 38 |
|
Maryland |
7.8 | 42 |
|
Arizona |
8.0 | 43 |
|
New Mexico |
8.1 | 44 |
|
District of Columbia |
8.2 | 45 |
|
New Jersey |
8.2 | 45 |
|
California |
9.3 | 47 |
|
Louisiana |
9.4 | 48 |
|
New York |
9.6 | 49 |
|
Nevada |
12.0 | 50 |
|
Hawaii |
14.3 | 51 |
|
Footnotes |
||
|
Note: Rates shown are a percentage of the labor force. Data refer to place of residence. Estimates for the current month are subject to revision the following month. |
||
Last Modified Date: November 20, 2020