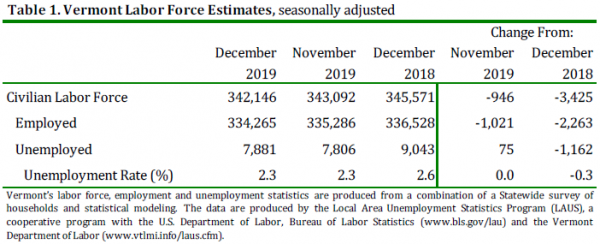
by Timothy McQuiston, Vermont Business Magazine The December 2019 unemployment rate was unchanged from last month, but the three major data points were all worse from November and both the Labor Force and Employment were worse from a year ago. However, the Unemployment numbers from last year improved by over thousand and the rate itself is down three-tenths. The Vermont Department of Labor released data on the Vermont economy Friday morning. According to household data, the seasonally-adjusted statewide unemployment rate for December was 2.3 percent. The preliminary data released in December shows a labor force participation rate of 65.6 percent which is the lowest statewide level since September 1977.
The seasonally-adjusted Vermont data for December show the Vermont civilian labor force decreased by 946 from the prior month’s revised estimate. The number of employed persons decreased by 1,021 and the number of unemployed persons increased by 75. The change to the number of employed persons was statistically significant in the seasonally-adjusted series.
The comparable United States unemployment rate in December was 3.5 percent, which was also unchanged from the revised November estimate. Vermont continues to have the lowest rate in the nation, tied with South Carolina and Utah. New Hampshire is number 6 at 2.6 percent.
“This month’s jobs report shows Vermont’s unemployment rate holding steady, with a slight decline in the number of employed individuals," said Michael Harrington, Acting Labor Commissioner. "Additionally, as members of the baby-boomer generation continue to exit the workforce, this has had a direct impact on our Labor Force Participation Rate. It is because of this that the Department of Labor continues to place labor force expansion at the top of its priority list. Whether through new apprenticeship opportunities or creating career pathways for New Americans, the growth of Vermont’s workforce is critical to our sustainable success. As we begin a new year, we must also recommit ourselves to working together to meet this challenge.”
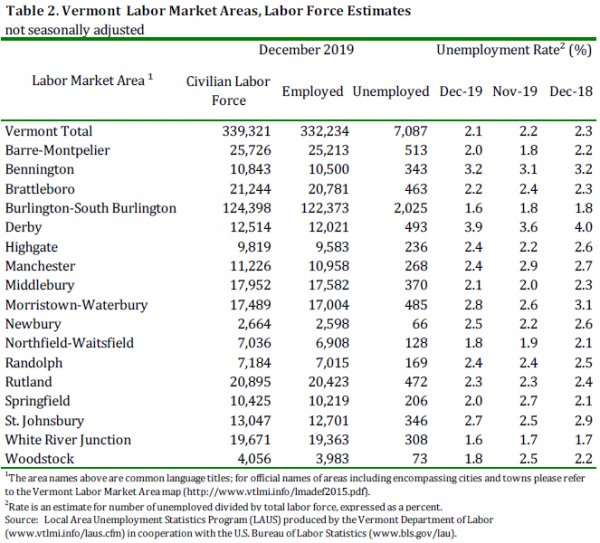
The December unemployment rates for Vermont’s 17 labor market areas ranged from 1.6 percent in Burlington-South Burlington and White River Junction to 3.9 percent in Derby (note: local labor market area unemployment rates are not seasonally-adjusted). For comparison, the December unadjusted unemployment rate for Vermont was 2.1 percent, which was a decrease of one-tenth of one percentage point from the revised unadjusted November level and a decrease of two-tenths of one percentage point from a year ago.
Not-Seasonally-Adjusted
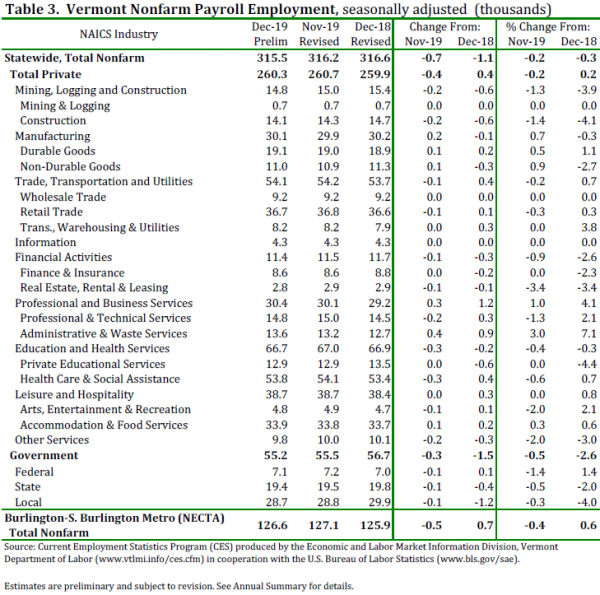
The preliminary ‘not-seasonally-adjusted’ jobs estimates for December show an increase of 3,200 jobs when compared to the revised November numbers. There was a decrease of 300 jobs between the preliminary and the revised November estimates due to the inclusion of more data. The monthly increase seen in the December numbers was primarily attributable to leisure and hospitality related activities. The broader economic trends can be detected by focusing on the over-the-year changes in this data series. As detailed in the preliminary ‘not-seasonally-adjusted’ December data, Total Private industries have increased by 400 jobs (0.2 percent) and Government (including public education) employment has decreased by 1,800 jobs (-3.0 percent) in the past year.
Seasonally-Adjusted
The seasonally-adjusted data for December reports a decrease of 700 jobs from the revised November data. As with the ‘not-seasonally-adjusted’ data, this over-the-month change is from the revised November numbers which experienced a decrease of 300 jobs from the preliminary estimates. The seasonally-adjusted over-the-month changes in December varied at the sub-sector level. Those with a notable increase include: Administrative & Waste Services (+400 jobs or +3.0%), and Manufacturing (+200 jobs or +0.7%). Sectors with a notable decrease include: Real Estate, Rental & Leasing (-100 jobs or -3.4%), Other Services (-200 jobs or -2.0%), and Arts, Entertainment & Recreation (-100 jobs or -2.0%).
| State | December 2019(P) rate |
Rank |
|---|---|---|
|
South Carolina |
2.3 | 1 |
|
Utah |
2.3 | 1 |
|
Vermont |
2.3 | 1 |
|
North Dakota |
2.4 | 4 |
|
Colorado |
2.5 | 5 |
|
Hawaii |
2.6 | 6 |
|
New Hampshire |
2.6 | 6 |
|
Virginia |
2.6 | 6 |
|
Alabama |
2.7 | 9 |
|
Iowa |
2.7 | 9 |
|
Massachusetts |
2.8 | 11 |
|
Idaho |
2.9 | 12 |
|
Maine |
2.9 | 12 |
|
Florida |
3.0 | 14 |
|
Nebraska |
3.1 | 15 |
|
Georgia |
3.2 | 16 |
|
Indiana |
3.2 | 16 |
|
Kansas |
3.2 | 16 |
|
South Dakota |
3.2 | 16 |
|
Minnesota |
3.3 | 20 |
|
Missouri |
3.3 | 20 |
|
Tennessee |
3.3 | 20 |
|
Montana |
3.4 | 23 |
|
Oklahoma |
3.4 | 23 |
|
Wisconsin |
3.4 | 23 |
|
Maryland |
3.5 | 26 |
|
New Jersey |
3.5 | 26 |
|
Rhode Island |
3.5 | 26 |
|
Texas |
3.5 | 26 |
|
Arkansas |
3.6 | 30 |
|
Connecticut |
3.7 | 31 |
|
Illinois |
3.7 | 31 |
|
North Carolina |
3.7 | 31 |
|
Oregon |
3.7 | 31 |
|
Wyoming |
3.7 | 31 |
|
Nevada |
3.8 | 36 |
|
California |
3.9 | 37 |
|
Delaware |
3.9 | 37 |
|
Michigan |
3.9 | 37 |
|
New York |
4.0 | 40 |
|
Ohio |
4.2 | 41 |
|
Kentucky |
4.3 | 42 |
|
Washington |
4.3 | 42 |
|
Pennsylvania |
4.5 | 44 |
|
Arizona |
4.6 | 45 |
|
New Mexico |
4.7 | 46 |
|
Louisiana |
4.9 | 47 |
|
West Virginia |
5.0 | 48 |
|
District of Columbia |
5.3 | 49 |
|
Mississippi |
5.7 | 50 |
|
Alaska |
6.1 | 51 |
|
Footnotes |
||
|
Note: Rates shown are a percentage of the labor force. Data refer to place of residence. Estimates for the current month are subject to revision the following month. |
||
Last Modified Date: January 24, 2020
NOTE: The Unemployment and Jobs Report for January is scheduled to be released on Monday, March 16, 2020 at 10:00 a.m.; the Unemployment and Jobs Report for February is scheduled to be released on Friday, March 27, 2020 at 10:00 a.m.