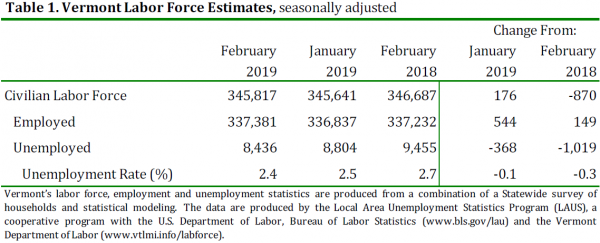
Vermont Business Magazine One month after reaching a historic low, Vermont's unemployment rate fell again to a record low 2.4 percent in February, according to the Vermont Department of Labor report released Friday morning. The February rate reflects a decrease of one-tenth of one percentage point from the revised January rate. The current estimate of 8,436 unemployed Vermonters is the lowest total since April 1988. While the number of employed has increased, the year-over-year data reveals a decrease in the labor force and a steep decline in the number of people unemployed. Vermont is now tied with Iowa, New Hampshire and North Dakota for the lowest rate in the nation.
“Vermont’s unemployment rate continues to reach new lows. The scarcity of labor in Vermont is putting upward pressure on wage growth and downward pressure on employment growth. Taking a step back, the changes in employment growth from the last economic peak are startling. Between 2007 and 2018, the Vermont economy is estimated to have added 7,100 jobs. Over the same time period, the Burlington metro area has added 9,800 jobs. This means that over this 11-year period, the balance of the state - net the Burlington metro area – has 2,700 fewer jobs. To improve these outcomes, Vermont needs more workers to fill the open jobs across the state. These trends are another reason why the Department continues to heavily focus on assisting all employers across the state with the recruitment and retention of workers. If you are a business, or a job-seeker, reach out to your local Career Resource Center to learn how we can help,” said Labor Commissioner Lindsay Kurrle.
While the Vermont jobless rate fell in February to 2.4 percent, the comparable United States rate in February fell to 3.8 percent, which was a decrease of two-tenths of one percentage point from the revised January estimate. The seasonally-adjusted Vermont data for February show the Vermont civilian labor force increased by 176 from the prior month’s revised estimate. The number of employed persons increased by 544 and the number of unemployed persons decreased by 368. The changes to the number of unemployed persons and the unemployment rate were statistically significant in the seasonally-adjusted series.
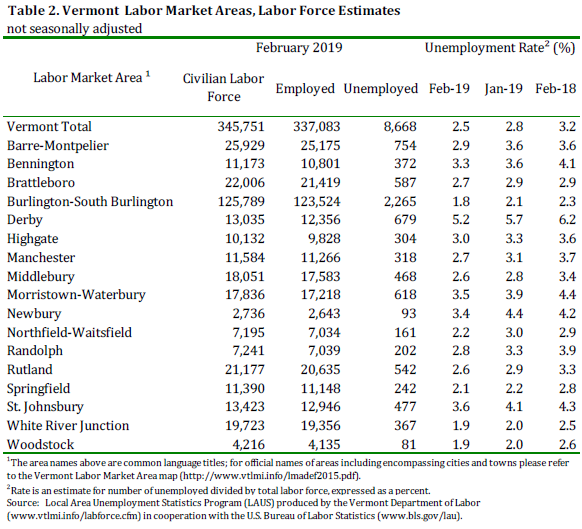
The February unemployment rates for Vermont’s 17 labor market areas ranged from 1.8 percent in Burlington-South Burlington to 5.2 percent in Derby (note: local labor market area unemployment rates are not seasonally-adjusted). For comparison, the February unadjusted unemployment rate for Vermont was 2.5 percent which was a decrease of three-tenths of one percentage point from the revised unadjusted January level and a decrease of seven-tenths of one percentage point from a year ago.
Not-Seasonally-Adjusted
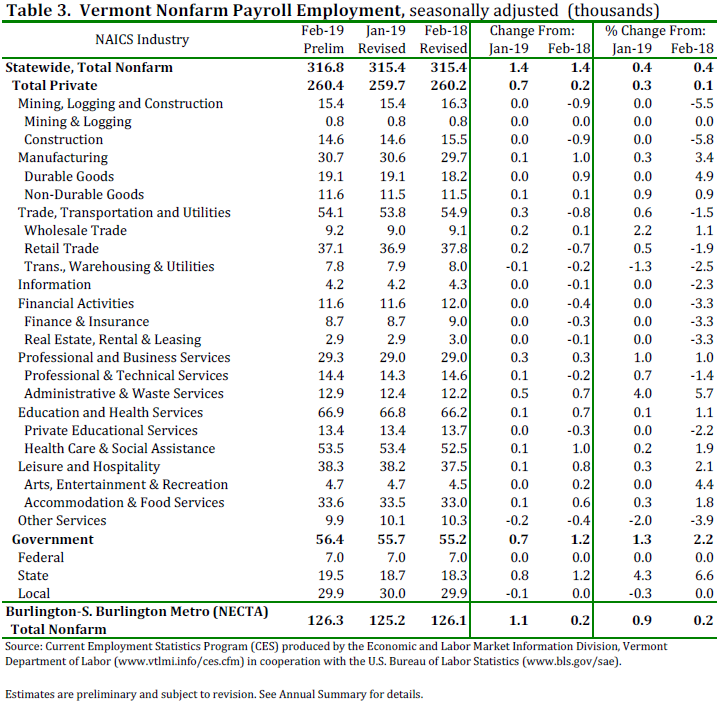
The preliminary ‘not-seasonally-adjusted’ jobs estimates for February show an increase of 3,900 jobs when compared to the revised January numbers. There was a decrease of 300 jobs between the preliminary and the revised January estimates due to the inclusion of more data. The monthly increase seen in the February numbers was primarily attributable to seasonal activity related to education. The broader economic trends can be detected by focusing on the over-the-year changes in this data series. As detailed in the preliminary ‘not-seasonally-adjusted’ February data, Total Private industries have increased by 2,000 jobs (0.8 percent) and Government (including public education) employment has increased by 1,100 jobs (1.9 percent) in the past year.
Seasonally-Adjusted
The seasonally-adjusted data for February reports an increase of 1,400 jobs from the revised January data. As with the ‘not-seasonally-adjusted’ data, this over-the-month change is from the revised January numbers which experienced no change from the preliminary estimates. The seasonally-adjusted over-the-month changes in February varied at the sector level. Those with a notable increase include: State Government (+800 jobs or +4.3%), Administrative & Waste Services (+500 jobs or +4.0%), and Wholesale Trade (+200 jobs or +2.2%). Sectors with a notable decrease include: Other Services (-200 jobs or -2.0%) and Transportation, Warehousing & Utilities (-100 jobs or - 1.3%).
| State | February 2019(p) rate |
Rank |
|---|---|---|
|
Iowa |
2.4 | 1 |
|
New Hampshire |
2.4 | 1 |
|
North Dakota |
2.4 | 1 |
|
Vermont |
2.4 | 1 |
|
Hawaii |
2.7 | 5 |
|
Nebraska |
2.8 | 6 |
|
Idaho |
2.9 | 7 |
|
South Dakota |
2.9 | 7 |
|
Virginia |
2.9 | 7 |
|
Wisconsin |
2.9 | 7 |
|
Massachusetts |
3.0 | 11 |
|
Utah |
3.0 | 11 |
|
Minnesota |
3.1 | 13 |
|
Missouri |
3.2 | 14 |
|
South Carolina |
3.2 | 14 |
|
Tennessee |
3.2 | 14 |
|
Oklahoma |
3.3 | 17 |
|
Delaware |
3.4 | 18 |
|
Kansas |
3.4 | 18 |
|
Maine |
3.4 | 18 |
|
Florida |
3.5 | 21 |
|
Indiana |
3.5 | 21 |
|
Alabama |
3.7 | 23 |
|
Colorado |
3.7 | 23 |
|
Maryland |
3.7 | 23 |
|
Arkansas |
3.8 | 26 |
|
Connecticut |
3.8 | 26 |
|
Montana |
3.8 | 26 |
|
Texas |
3.8 | 26 |
|
Georgia |
3.9 | 30 |
|
New York |
3.9 | 30 |
|
North Carolina |
3.9 | 30 |
|
Rhode Island |
3.9 | 30 |
|
Wyoming |
3.9 | 30 |
|
Michigan |
4.0 | 35 |
|
New Jersey |
4.0 | 35 |
|
Pennsylvania |
4.0 | 35 |
|
Kentucky |
4.1 | 38 |
|
California |
4.2 | 39 |
|
Illinois |
4.3 | 40 |
|
Nevada |
4.3 | 40 |
|
Oregon |
4.4 | 42 |
|
Washington |
4.5 | 43 |
|
Ohio |
4.6 | 44 |
|
Mississippi |
4.8 | 45 |
|
Louisiana |
4.9 | 46 |
|
Arizona |
5.1 | 47 |
|
New Mexico |
5.1 | 47 |
|
West Virginia |
5.2 | 49 |
|
District of Columbia |
5.5 | 50 |
|
Alaska |
6.5 | 51 |
|
Footnotes |
||
|
Note: Rates shown are a percentage of the labor force. Data refer to place of residence. Estimates for the current month are subject to revision the following month. |
||
Last Modified Date: March 22, 2019
Source: VT DOL 3.22.2019