NEW REPORT: State of Working Vermont 2019
As the economy recovers many are left behind
There are two differing views of Vermont’s economy. Both are true.
- The recession is over, the economy is expanding, and we have a record-breaking number of private sector jobs.
- Many Vermonters are hurting and unable to meet basic needs.
State of Working Vermont 2019 (click HERE for full report), published by Public Assets Institute in a readable chart-book format with brief explanatory text, takes a close look at a number of indicators to see how Vermonters and their families were faring economically at the end of 2018—the latest year for which most data are available—and how conditions have changed, for better or worse, in recent years.
It also points out that Vermont’s level of public investment has been flat for a quarter of a century and that our failure to make timely public investments is creating serious consequences for Vermonters.
REPORT
An economist looking at Vermont statistics can see that the state is benefiting from the U.S. economic expansion, which became the longest on record last summer: There are more jobs, higher wages, fewer children in poverty.1
At the same time, many Vermonters can look at their paychecks and wonder when the recession is going to end. The state’s economic growth continues to favor those who are well off, while low- and moderate-income families wait for things to pick up.
Both views are true.
Much of what this report shows—through indicators based largely on U.S. Census and economic data through 2018—is good news:
• Vermont’s economy expanded. Gross state product, a primary measure of economic activity, grew 1.2 percent last year after adjusting for inflation.
• Private sector job numbers in Vermont hit a new peak in 2018.
• Real wages grew for all income groups from 2010 to 2018.
• The number of children living below the federal poverty threshold hit its lowest level in 15 years.
• Vermont’s state and local taxes were among the least regressive in the country. Unfortunately, some of this progress was sluggish, and it did not reach all of the state’s residents.
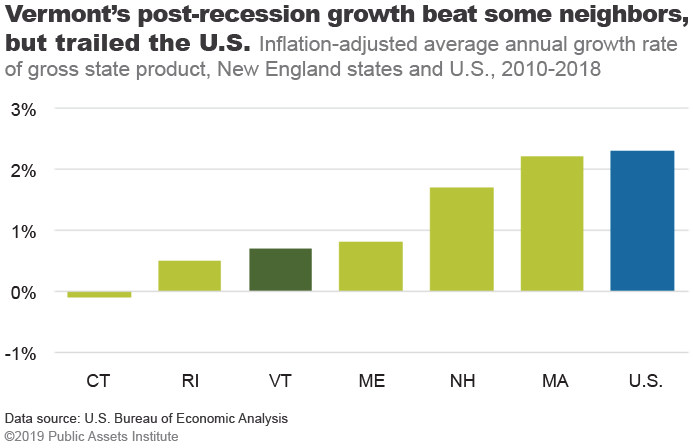
• From 2010 to 2018, Vermont’s economy grew at less than one-third the rate of the U.S. economy, which is having its slowest recovery since at least 1947.2
• The typical Vermont household’s buying power in 2018 was no better than it was for the typical household before the recession over 10 years ago.
• Wages rose faster after the recession for the highest-paid hourly workers than for those at the bottom.
• Last year’s median income for families headed by single mothers, $29,215, was less than it had been in 2010, after taking inflation into account.
• More than one in 10 Vermont children lived in poverty in 2018.
What do these mixed signals say about Vermont’s policies?
Policy makers recognize the importance of shared prosperity and the need to support working Vermonters and low-income families.
Vermont enacted a law in 2012 stating that the purpose of the state budget is to “address the needs of the people of Vermont in a way that advances human dignity and equity.” The statute also says: “Spending and revenue policies will reflect the public policy
goals established in state law and recognize every person’s need for health, housing, dignified work, education, food, social security, and a healthy environment.”3
In many cases Montpelier has followed through on that pledge. The year after that law was passed, the Legislature rejected an attempt by Governor Peter Shumlin to reduce Vermont’s earned income tax credit (EITC), which provides essential support for low-wage workers. In 2018, at Gov. Phil Scott’s urging, the Legislature increased the amount of the EITC.
Vermont recently closed loopholes in its tax structure to make it fairer. Vermont’s rate of uninsured people in 2018 was the second lowest in the country, thanks in part to its expansion of Medicaid eligibility in 2014 and to earlier decisions to cover more children and pregnant women. And in the 2019 session the Legislature approved funding increases for the Child Care Financial Assistance Program and, for the first time in 15 years, Reach Up, which provides cash assistance for children in extremely poor families.
While these were steps in the right direction, the increases were modest and long overdue. More than 10 percent of Vermont children still live in poverty, which for a single mother with two children means trying to make ends meet on just over $20,000 a year. More Vermonters were relying on 3SquaresVT to put food on the table in 2018 than before the start of the recession in 2007.4
And in spite of broad agreement that children, families, and workers would benefit from high-quality, affordable child care throughout Vermont, the major state investment necessary to accomplish that has so far fallen outside policy makers’ comfort zone. Efforts to enact paid family and medical leave have also foundered. The first time, the governor vetoed the legislation. In the most recent session, the Legislature didn’t get the bill to his desk. A payroll tax of one-half of one percent made policy makers nervous—more nervous than they were about denying Vermont workers the right and ability to be home when their families needed them.
For more than 20 years Montpelier has been guided by an unwritten policy: “Manage to the money.” This means that the amount Vermont spends each year is determined not by the state’s needs but by how much money the current revenue system will generate in the next fiscal year. That principle has stifled more ambitious plans that would have required balancing needs and revenues.
Needs and revenues: Recalibrating the balance
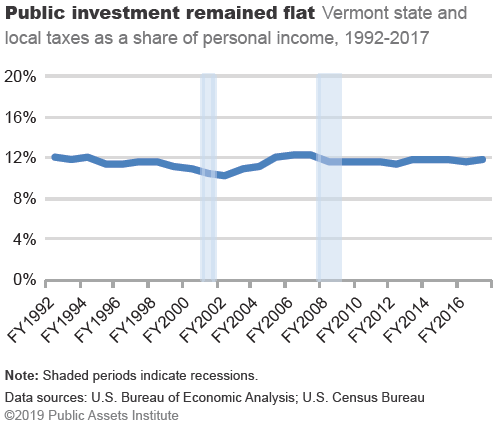 Whether intentionally or not, policy makers have locked themselves into a revenue structure that is unresponsive to social and economic changes. Taxes collected by state and local government as a share of Vermonters’ total annual income have been flat for 25 years (see chart). Vermont is committing the same percentage of available resources to public investments as it did in 1992. By managing to the money, policy makers are saying the level of effort made a generation ago is adequate to meet today’s challenges. But we can see from the current indicators that this is not so.
Vermonters are feeling the effects of the state’s failure to make timely investments.
Two examples: In 1991, policy makers decided they couldn’t afford the recommended contributions to the state pension funds and started a 14-year stretch of underfunding. Now it’s costing much more to catch up. State officials have been discussing pollution of Lake Champlain and other state waters for decades, but have not raised the money to reverse it. Now pollution has reached levels so dangerous that authorities are regularly closing beaches, and the costs of cleanup continue to rise.
The 2012 law establishing the purpose of the state budget refers to the two levers elected officials have to address Vermonters’ needs and promote their economic well-being: revenue policies and spending policies. Two questions confront us:
• Are the revenue policies adopted a quarter of a century ago adequate to meet Vermonters’ needs today and into the future?
• Will the investments Montpelier fails to make today become as costly as investments it failed to make in the past?
How can we tell if we’re making progress?
No single statistic or measure tells us whether Vermonters’ lives are improving. We can monitor factors that contribute to the expansion of the middle class: economic growth, job creation, income distribution, public policies, and public investments. But even when those indicators appear to be positive—such as a rising gross state product—it is crucial to look at what is happening to people and how the benefits of growth are distributed.
Measures such as poverty rates, income growth and disparity, housing affordability and homelessness, labor force expansion and job growth, health care coverage, and the availability of social and educational services let us see, at least statistically, who is getting ahead and who is falling behind. Putting these statistics together helps us understand where policy changes could make a difference to working families and start to break down some of the systemic barriers holding back single parents, people of color, and women.
It’s our elected officials’ job to understand these disparate signals—to hear from economists about the big picture and to listen to Vermonters about what their lives are like. It’s also their job to enact policies that make Vermont a state that works for everyone who lives here.
ECONOMY, INCOME, and INEQUALITY
GROSS STATE PRODUCT
Gross state product (GSP) is the state’s counterpart of gross domestic product (GDP), the nation’s output and perhaps the most commonly recognized economic measure. Real GSP is the total value of goods and services produced by the state after adjusting for inflation.
From 2010—the first full year after the official end of the Great Recession—to 2018, Vermont’s economy, as measured by gross state product, grew at less than one-third the rate of the country’s overall. Vermont’s annual growth rate, after adjusting for inflation, averaged 0.7 percent per year, compared with 2.3 percent for the U.S. That was also slower than Vermont’s own annual growth rate during the previous recovery (2002-07), which was 1.8 percent. From 2017 to 2018 Vermont’s real GSP grew by 1.2 percent.
Note: To address concerns that GSP was not the best way to measure economic well-being and that maximizing economic growth was not sustainable, in 2012 the Vermont Legislature officially adopted an additional metric: the genuine progress indicator (GPI), which was calculated for Vermont from 2000 to 2015. GPI estimates the dollar value of the net economic benefit produced in the state. Along with the growth captured by GSP, GPI incorporates other economic and social factors such as negative environmental impacts, the value of unpaid labor, and the economic drag from increasing income inequality. Between 2005 and 2015 Vermont’s GSP grew 8.7 percent while GPI declined slightly, due primarily to the cost of non-renewable energy and the negative effects of income inequality. GPI grew faster than GSP from 2013 to 2015.
HOURLY WAGE BY PERCENTILE
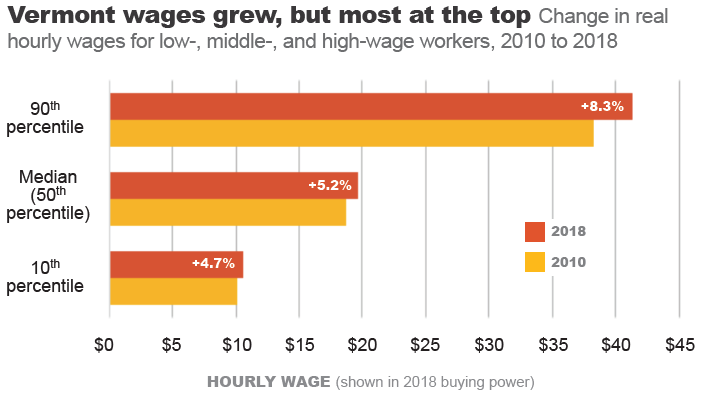
Hourly wage by percentile shows the share of workers making above or below a given wage at a particular time. At the 10th percentile, 10 percent of workers make less than that amount per hour and 90 percent make more. Each year the U.S. Census publishes hourly wages for selected percentiles. Tracking these levels over time indicates which workers are seeing their wages rise or fall.
Vermont’s annual unemployment rate has remained among the lowest in the nation for the past several years. At the same time, its labor force was smaller last year than in 2010, just after the recession. A tight labor market usually produces an increase in wages because employers have to compete for workers. But wages did not rise during most of this recovery—at least not for low- and middle-wage workers. In fact, from 2010 to 2018, these workers’ wages did not even keep pace with Vermont’s slowly growing economy, which increased 5.8 percent during the same period. Wages for those at the top, however, grew faster than the overall economy.
PROGRESSIVE TAXES: BASED ON ABILITY TO PAY
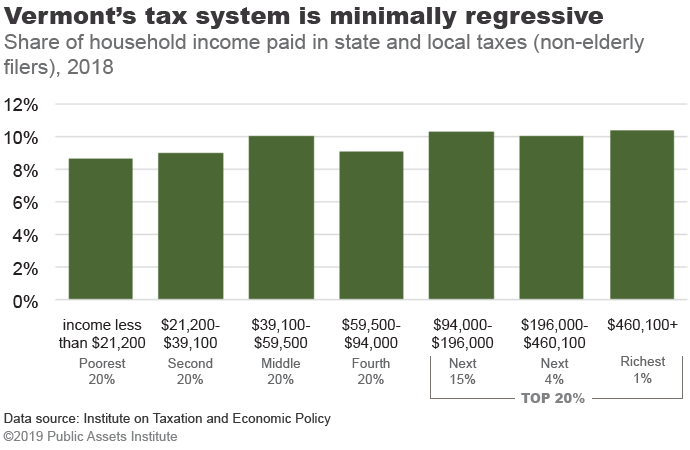
 Progressive tax systems impose higher rates on those with more income and lower rates on those with less income. Regressive systems tax the poor more heavily than the rich. There are various mechanisms to make systems more progressive that Vermont has adopted: an income tax with higher rates on higher income; sales tax exemptions on necessities that take a bigger bite of smaller earnings, such as food and medicine; and school taxes based not on property value but on income, which better conforms with ability to pay.
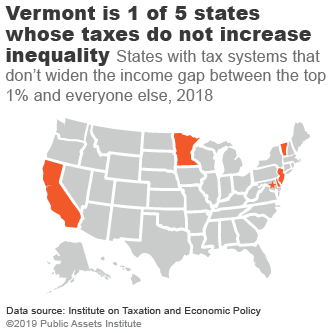
Vermont’s tax system won kudos, of a sort, from the Institute on Taxation and Economic Policy (ITEP) in 2018. It was one of five states, including California, Minnesota, Delaware, and New Jersey, plus the District of Columbia, whose tax systems “do not worsen income inequality.”5
In most states, low- and moderate-income people pay a larger share of their income in taxes than do the top 1 percent of taxpayers. In recent years Vermont has increased progressivity, for instance, by curbing some tax breaks that favor people with higher incomes.
FEDERAL TAX CHANGES
 Tax policy changes at the federal level have an impact on Vermont, both because they affect the amount of total taxes Vermonters pay and because they can lead to cuts in federal services that Vermonters use.
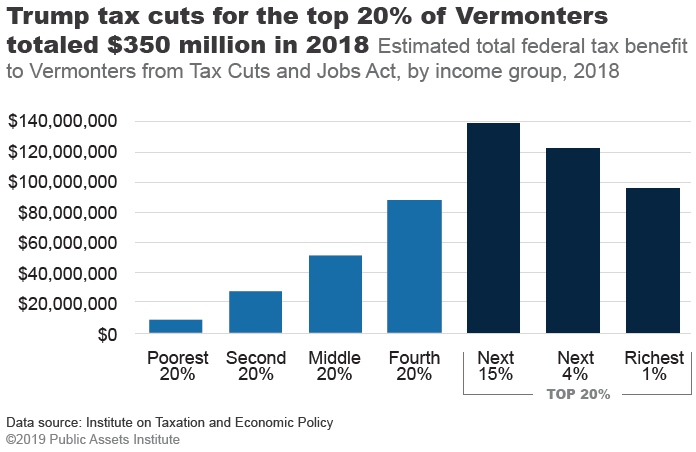
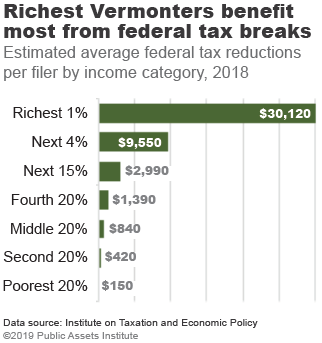
Federal tax changes since 2000, including the Tax Cuts and Jobs Act of 2017—the Trump tax cuts—have disproportionately benefited the wealthiest Vermonters. The average Vermonter in the top 1 percent had an income of $1 million, and got a new annual federal tax break of just over $30,000 in 2018. In contrast, Vermont’s lowest earners saved about $150. In both dollars and percentages of income, the tax cuts were larger for the top 20 percent than for the bottom 80 percent. The total windfall for those in the top 20 percent of tax filers came to more than $350 million in 2018, and the tax breaks will continue until they expire or change.
1 Economic recessions and expansions tracked by the National Bureau of Economic Research date back to 1854. The previous record for economic expansions, 120
months, occurred after the recession in the early 1990s. http://www.nber.org/cycles/cyclesmain.html
2 Kavet, Rockler & Associates, LLC, “Economic Review and Revenue Forecast Update” (July 2019), 1, https://ljfo.vermont.gov/assets/Meetings/Joint-Fiscal-Committee/2019-
07-29/112c9a4cc9/Kavet-Revenue-Commentary-0719-Final.pdf
3 32 V.S.A. §306a
4 3SquaresVT is Vermont’s name for the federal Supplemental Nutrition Assistance Program (SNAP), commonly referred to as food stamps.
5 Institute on Taxation and Economic Policy, “Who Pays? A Distributional Analysis of the Tax Systems in All 50 States” (2018), 9, https://itep.org/whopays/
Source: Public Assets Institute Montpelier. 12.26.2019 publicassets.org