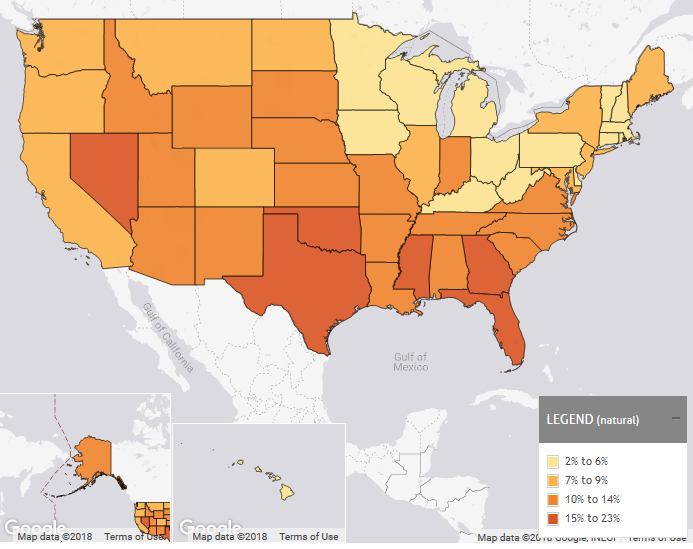
Vermont Business Magazine In the United States, the proportion of parents without health insurance has dropped 39 percent in just six years, according to the Annie E Casey Foundation's Kids Count Data Center. Today, only 11 percent of parents lack health coverage. At the state level, the rate of uninsured parents fell without exception. West Virginia reported the greatest change — a drop of 14 percent — leaving just 5 percent of parents uninsured in 2016. Maine, Massachusetts and Wisconsin reported the smallest drop — a dip of 1 percent. But those states already have high rates of coverage. Massachusetts is first with only 2 percent of parents not covered by health insurance. Vermont was tied for second with Hawaii at 3 percent not covered.
Despite these improvements, 6.4 million parents are still without health insurance. One in five of these parents live in Texas, which has the highest rate of uninsured parents nationwide (23%). At the other end of the spectrum sits Massachusetts, where just 2 percent of parents lack health insurance.
Unforeseen medical expenses and accidents can threaten a family's economic stability, and this risk is even greater when a family member is uninsured. Parents who lack coverage may forgo needed medical attention, which can hinder their ability to take care of themselves and their loved ones. On the other hand, having health insurance supports parents' well-being and increases the likelihood that their children are also insured.
| Location | Data Type | 2009 | 2010 | 2014 | 2015 | 2016 |
|---|---|---|---|---|---|---|
|
Alabama
|
Number
|
164,000
|
170,000
|
141,000
|
114,000
|
100,000
|
|
Percent
|
17%
|
19%
|
16%
|
13%
|
11%
|
|
|
Alaska
|
Number
|
30,000
|
25,000
|
23,000
|
17,000
|
19,000
|
|
Percent
|
20%
|
16%
|
15%
|
12%
|
13%
|
|
|
Arizona
|
Number
|
253,000
|
240,000
|
193,000
|
157,000
|
150,000
|
|
Percent
|
20%
|
19%
|
16%
|
13%
|
12%
|
|
|
Arkansas
|
Number
|
151,000
|
137,000
|
94,000
|
75,000
|
65,000
|
|
Percent
|
25%
|
24%
|
17%
|
13%
|
12%
|
|
|
California
|
Number
|
1,553,000
|
1,604,000
|
1,112,000
|
796,000
|
672,000
|
|
Percent
|
20%
|
21%
|
15%
|
11%
|
9%
|
|
|
Colorado
|
Number
|
180,000
|
186,000
|
134,000
|
116,000
|
103,000
|
|
Percent
|
17%
|
18%
|
12%
|
11%
|
9%
|
|
|
Connecticut
|
Number
|
59,000
|
55,000
|
42,000
|
40,000
|
34,000
|
|
Percent
|
8%
|
8%
|
6%
|
6%
|
5%
|
|
|
Delaware
|
Number
|
15,000
|
18,000
|
15,000
|
12,000
|
10,000
|
|
Percent
|
9%
|
10%
|
9%
|
7%
|
6%
|
|
|
District of Columbia
|
Number
|
4,000
|
4,000
|
4,000
|
3,000
|
3,000
|
|
Percent
|
5%
|
5%
|
5%
|
3%
|
3%
|
|
|
Florida
|
Number
|
838,000
|
843,000
|
655,000
|
533,000
|
504,000
|
|
Percent
|
25%
|
26%
|
20%
|
16%
|
15%
|
|
|
Georgia
|
Number
|
455,000
|
472,000
|
400,000
|
354,000
|
329,000
|
|
Percent
|
22%
|
24%
|
20%
|
18%
|
16%
|
|
|
Hawaii
|
Number
|
14,000
|
15,000
|
11,000
|
7,000
|
7,000
|
|
Percent
|
5%
|
6%
|
4%
|
3%
|
3%
|
|
|
Idaho
|
Number
|
79,000
|
78,000
|
61,000
|
46,000
|
47,000
|
|
Percent
|
22%
|
23%
|
19%
|
14%
|
14%
|
|
|
Illinois
|
Number
|
353,000
|
360,000
|
268,000
|
218,000
|
201,000
|
|
Percent
|
13%
|
14%
|
11%
|
9%
|
8%
|
|
|
Indiana
|
Number
|
212,000
|
225,000
|
183,000
|
146,000
|
125,000
|
|
Percent
|
16%
|
17%
|
15%
|
12%
|
10%
|
|
|
Iowa
|
Number
|
61,000
|
66,000
|
47,000
|
34,000
|
33,000
|
|
Percent
|
10%
|
11%
|
8%
|
6%
|
5%
|
|
|
Kansas
|
Number
|
97,000
|
99,000
|
79,000
|
71,000
|
63,000
|
|
Percent
|
16%
|
17%
|
14%
|
12%
|
11%
|
|
|
Kentucky
|
Number
|
164,000
|
151,000
|
87,000
|
57,000
|
44,000
|
|
Percent
|
18%
|
18%
|
10%
|
7%
|
5%
|
|
|
Louisiana
|
Number
|
201,000
|
195,000
|
158,000
|
129,000
|
106,000
|
|
Percent
|
22%
|
22%
|
19%
|
15%
|
13%
|
|
|
Maine
|
Number
|
21,000
|
18,000
|
21,000
|
18,000
|
15,000
|
|
Percent
|
9%
|
8%
|
10%
|
8%
|
7%
|
|
|
Maryland
|
Number
|
131,000
|
129,000
|
95,000
|
85,000
|
75,000
|
|
Percent
|
11%
|
11%
|
8%
|
7%
|
7%
|
|
|
Massachusetts
|
Number
|
37,000
|
39,000
|
33,000
|
27,000
|
22,000
|
|
Percent
|
3%
|
3%
|
3%
|
2%
|
2%
|
|
|
Michigan
|
Number
|
253,000
|
246,000
|
163,000
|
114,000
|
103,000
|
|
Percent
|
13%
|
13%
|
9%
|
6%
|
6%
|
|
|
Minnesota
|
Number
|
90,000
|
92,000
|
63,000
|
54,000
|
52,000
|
|
Percent
|
8%
|
8%
|
6%
|
5%
|
5%
|
|
|
Mississippi
|
Number
|
127,000
|
134,000
|
99,000
|
87,000
|
79,000
|
|
Percent
|
22%
|
23%
|
18%
|
16%
|
15%
|
|
|
Missouri
|
Number
|
191,000
|
185,000
|
162,000
|
128,000
|
128,000
|
|
Percent
|
16%
|
16%
|
14%
|
11%
|
11%
|
|
|
Montana
|
Number
|
38,000
|
39,000
|
32,000
|
22,000
|
17,000
|
|
Percent
|
22%
|
21%
|
18%
|
12%
|
9%
|
|
|
Nebraska
|
Number
|
53,000
|
52,000
|
47,000
|
42,000
|
45,000
|
|
Percent
|
14%
|
14%
|
12%
|
11%
|
12%
|
|
|
Nevada
|
Number
|
127,000
|
136,000
|
93,000
|
78,000
|
78,000
|
|
Percent
|
24%
|
25%
|
18%
|
15%
|
15%
|
|
|
New Hampshire
|
Number
|
30,000
|
33,000
|
23,000
|
17,000
|
14,000
|
|
Percent
|
11%
|
13%
|
10%
|
7%
|
6%
|
|
|
New Jersey
|
Number
|
204,000
|
226,000
|
212,000
|
175,000
|
166,000
|
|
Percent
|
11%
|
12%
|
12%
|
10%
|
9%
|
|
|
New Mexico
|
Number
|
97,000
|
105,000
|
74,000
|
58,000
|
46,000
|
|
Percent
|
25%
|
26%
|
20%
|
16%
|
13%
|
|
|
New York
|
Number
|
407,000
|
444,000
|
348,000
|
284,000
|
243,000
|
|
Percent
|
11%
|
12%
|
10%
|
8%
|
7%
|
|
|
North Carolina
|
Number
|
364,000
|
397,000
|
324,000
|
288,000
|
259,000
|
|
Percent
|
19%
|
21%
|
17%
|
15%
|
13%
|
|
|
North Dakota
|
Number
|
12,000
|
12,000
|
12,000
|
11,000
|
10,000
|
|
Percent
|
10%
|
9%
|
8%
|
8%
|
7%
|
|
|
Ohio
|
Number
|
251,000
|
240,000
|
164,000
|
134,000
|
115,000
|
|
Percent
|
11%
|
11%
|
8%
|
6%
|
5%
|
|
|
Oklahoma
|
Number
|
189,000
|
183,000
|
143,000
|
133,000
|
135,000
|
|
Percent
|
25%
|
25%
|
19%
|
18%
|
18%
|
|
|
Oregon
|
Number
|
143,000
|
146,000
|
86,000
|
66,000
|
57,000
|
|
Percent
|
19%
|
20%
|
12%
|
9%
|
8%
|
|
|
Pennsylvania
|
Number
|
247,000
|
259,000
|
226,000
|
156,000
|
138,000
|
|
Percent
|
10%
|
11%
|
10%
|
7%
|
6%
|
|
|
Puerto Rico
|
Number
|
49,000
|
46,000
|
29,000
|
26,000
|
28,000
|
|
Percent
|
7%
|
7%
|
5%
|
5%
|
5%
|
|
|
Rhode Island
|
Number
|
20,000
|
20,000
|
14,000
|
11,000
|
9,000
|
|
Percent
|
10%
|
10%
|
7%
|
6%
|
5%
|
|
|
South Carolina
|
Number
|
164,000
|
165,000
|
146,000
|
109,000
|
97,000
|
|
Percent
|
19%
|
19%
|
17%
|
13%
|
11%
|
|
|
South Dakota
|
Number
|
25,000
|
22,000
|
17,000
|
20,000
|
17,000
|
|
Percent
|
15%
|
14%
|
11%
|
12%
|
10%
|
|
|
Tennessee
|
Number
|
195,000
|
181,000
|
164,000
|
135,000
|
118,000
|
|
Percent
|
15%
|
15%
|
13%
|
11%
|
10%
|
|
|
Texas
|
Number
|
1,712,000
|
1,731,000
|
1,485,000
|
1,385,000
|
1,361,000
|
|
Percent
|
31%
|
31%
|
26%
|
24%
|
23%
|
|
|
Utah
|
Number
|
106,000
|
118,000
|
98,000
|
83,000
|
72,000
|
|
Percent
|
16%
|
18%
|
14%
|
12%
|
10%
|
|
|
Vermont
|
Number
|
8,000
|
6,000
|
5,000
|
3,000
|
3,000
|
|
Percent
|
7%
|
6%
|
4%
|
3%
|
3%
|
|
|
Virginia
|
Number
|
209,000
|
228,000
|
210,000
|
160,000
|
160,000
|
|
Percent
|
13%
|
14%
|
13%
|
10%
|
10%
|
|
|
Washington
|
Number
|
202,000
|
222,000
|
151,000
|
119,000
|
106,000
|
|
Percent
|
15%
|
16%
|
11%
|
9%
|
8%
|
|
|
West Virginia
|
Number
|
63,000
|
63,000
|
29,000
|
19,000
|
17,000
|
|
Percent
|
18%
|
19%
|
9%
|
6%
|
5%
|
|
|
Wisconsin
|
Number
|
78,000
|
81,000
|
86,000
|
65,000
|
63,000
|
|
Percent
|
7%
|
7%
|
8%
|
6%
|
6%
|
|
|
Wyoming
|
Number
|
22,000
|
22,000
|
15,000
|
14,000
|
13,000
|
|
Percent
|
19%
|
19%
|
13%
|
12%
|
12%
|