Vermont Business Magazine An already gloomy tax revenue situation for the current fiscal year was further downgraded by the Emergency Board Friday afternoon. Economists Jeff Carr and Tom Kavet presented their revenue forecasts for FY2018 (which began July 1) and for FY2019. Last January they had downgraded revenue projections by $24.7 million, but on Friday the new estimate was down $28.8 million.
Governor Scott and legislative leaders have already come up with a plan to meet a shortfall in corporate revenues due to refunds of $16.3 million, but will need to find the other $12.5 million in August when decisions on budget cuts will be made.
Carr, of Economic & Police Resources of Williston, represents the administration and Kavet, of Kavet, Rockler & Associates of Williamstown, represents the Legislature. They develop a consensus revenue report twice a year and present it publicly to the Emergency Board in January and July.
The total state budget is $5.8 billion, with about a third of that coming from the federal government. The General Fund (which does not include the federal share, Transportation Fund, Education Fund or the property tax) is $1.5 billion.
Kavet wrote in his report that the overall economic scene appears to be getting worse here and across the nation, despite a historically long and slow recovery from the “Great Recession.” For instance, housing values in Vermont only recently caught up to their 2008 values. Vermont continues to struggle with slow population and employment growth, he said.
“The post-election “Trump bump,” which raised expectations of stronger near-term economic growth via lower taxes, increased infrastructure spending and reduced regulations, has fizzled amidst the dysfunction of an often chaotic federal administration in its first 6 months. To date, there is still little clarity on health care reform, tax policy, international trade, foreign affairs, and infrastructure investment. The clarity on immigration has led to negative economic effects, which will intensify as qualified students, workers and entrepreneurs increasingly avoid or are denied U.S. residency – limiting one of the most significant historical engines of U.S. economic growth. Although regulatory changes will aid some sectors and tax cuts are likely, most macroeconomic forecasts (including Moody’s, upon which these revenues estimates are based) have adjusted near-term economic growth back to pre-election levels and are focused now on the durability of the slow, steady expansion that is currently the third longest in U.S. history.
State revenues across all three major funds reviewed FY17 within 0.16% of prior January forecasts, the lowest margin of error in the last 20 years. The General Fund closed the year a mere 0.07% above targets, with the T-Fund falling about 1% below estimates due primarily to shortfalls in new Motor Vehicle Fees implemented in FY17. The Education Fund was about 0.5% below prior projections, caused by soft Sales & Use tax receipts.
FY18 revenues are expected to be slightly below prior January projections, as macroeconomic assumptions have been downgraded and several large “onetime” corporate refunds are in the pipeline. Most other changes to the revenue and economic forecast are technical adjustments based on recent revenue experience and tax law changes. For example, almost half of the FY19 G-Fund reduction and all of the E-Fund increase in the same year are due to a change in the share of the Sales & Use tax allocated to the E-Fund.
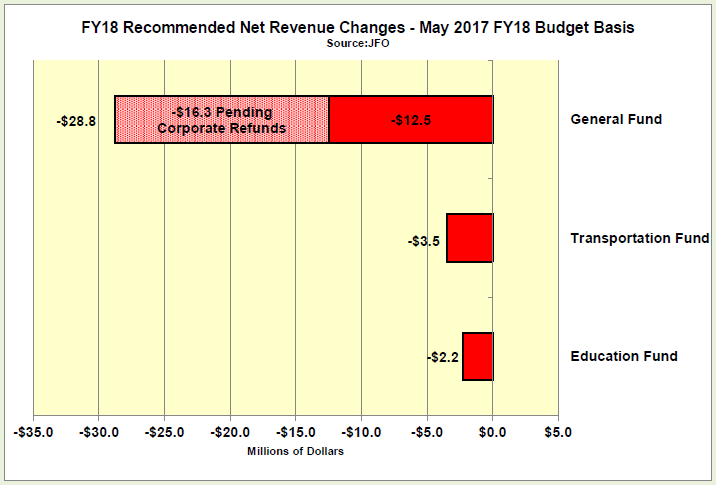
The Joint Fiscal Office added this note to the consensus report: “The Fiscal Year 2018 Budget as passed and enacted in Act 85 of 2017 was based upon the January adopted official forecast and revenue adjustments estimated by JFO that were enacted during the legislative session. These adjustments had been estimated to total $4.1 million for the General Fund and $0.6 million for the Education Fund. For the purpose of identifying the FY18 budget impact and subsequent rescission impact of the current forecast update, the July 2017 recommended revenue forecast is compared in the below chart to the budget position when enacted in May of 2017.
“Sec. D.105 of Act 85 required State economists to the identify the portion of the General Fund forecast that is due to higher than normal corporate tax refunds, estimated to be $16.3 million, and authorized specified fund transfers to address this portion of any revenue downgrade. The remaining portion of any downgrade is to be addressed by the existing rescission statute in 32 V.S.A. § 704.
“The result of the new revenue forecast is a General Fund budget position below the budgeted level by about $28.8 million of which $16.3 million is due to pending corporate tax refunds and $12.5 million is a base revenue reduction.”
 Kavet’s report states:
- If the current expansion persists another two years, as currently forecast, it will be longest sustained period of economic growth on record (see chart on preceding page). Part of its legacy, however, will be the very low rates of growth experienced: about 2.1% per year real U.S. GDP growth and average employment growth of about 1.6% - vs rates of about 3.6% and 2.2%, respectively, during the longest prior (and current duration record) period from March of 1991 to March of 2001.
- As any economic expansion ages, however, the risks of a downturn become heightened. Although there do not appear to be imbalances in the economy now that would precipitate a near term economic decline (within the 2 year statutory forecast horizon), the consensus macroeconomic forecast that forms the basis of the longer term (non-statutory) revenue forecasts now calls for a slowing of growth, though not a recession, in 2020 and 2021, with most revenue impacts concentrated in FY21.
- Labor markets continue to tighten, with U.S. and Vermont unemployment rates continuing to drop. The New England unemployment rate, however, has risen slightly since the start of the year, increasing from 3.6% in January to 4.1% in May. This is entirely the result of increases in Connecticut, which went from 4.4% to 4.9% during the same period, and Massachusetts, which went from 3.2% to 4.2%, after briefly registering a (statistically questionable) rate below that of Vermont at the end of 2016. The chart on the following page illustrates state unemployment rate rankings, and the maps on subsequent pages show all U.S. counties and New England town unemployment rates for the most recent 12 month period.
- Vermont is currently tied with Wisconsin and Iowa for the 7th lowest unemployment rate in the nation, at a seasonally adjusted monthly rate of 3.1% in May, the latest period for which data are available. In New England, Vermont has the second lowest rate, after New Hampshire, which has posted a rate between 2.7% and 2.9% in each of the last 18 months. •
- After nine long years, in the first quarter of 2017, Vermont housing prices finally exceeded their prior cyclical peak levels reached in the first quarter of 2008 – the longest cyclical real estate market downturn on record. Per the chart on the next page, Vermont now joins 30 other states that have reached this milestone, including Massachusetts, which is the only other New England state with this distinction.
- Home prices in Vermont will have to rise much more before acting as a meaningful stimulus to new residential construction activity. Residential building starts in the 12 month period ending in May of 2017 totaled about $296 million, up 13% from May of 2016, but less than half the $697 million peak level reached in the 12 month period ending in March of 2006. Nonresidential construction in the most recent 12 month period totaled $336 million, down 7% from year ago levels. On the strength of an $80 million wind farm project started in Searsburg and Readsboro last Fall, nonbuilding construction totaled $441 million in the 12 month period ending in May of this year - and pushed total Vermont construction starts in the last 12 months over the $1 billion mark.
- Inflation has been surprisingly low over the past six months, dropping from about 2.8% in January to 1.6% in June. Although interest rate hikes by the Fed are likely over the next several years as the economy continues to strengthen and labor markets recover, the relatively low current rates of inflation provide the Fed with considerable latitude with respect to timing. It would not be surprising to see planned rate hikes delayed if job growth lags, labor force participation does not increase, wages remain stagnant and inflation is at or under 2%.
- Although markets have been remarkably calm throughout the tumult of the first six months of the Trump Administration, the primary macroeconomic forecast risks are still associated with potential policy mistakes and related institutional conflict that may occur under the new Administration. There is still a wide gap of uncertainty between what has been said and what may actually be implemented in a number of key policy areas. While possible that some of the more extreme Trump proposals will be tempered by legislative processes and the realities of governing, there remains the risk that erratic talk will turn into erratic policies and/or erratic implementation of policies with negative economic impacts.
 State Revenues
Kavet reported that Corporate income tax revenues, despite the refund, have continued to be strong, the Personal income tax, by far the largest General Fund source, is at just about break-even, while the Sales tax, mired in a long slump, will see only a mild increase from online tax collections.
- The extreme volatility inherent in the State’s reliance on Personal Income, Corporate and Estate taxes was on display in FY17, with fiscal year-end revenues in Corporate exceeding expectations, despite an 18% decline from the previous fiscal year (along with large pending refunds), disappointing Personal Income paid returns in April, and nearly $5 million in fourth quarter Estate tax collections that brought the fiscal year total to within about a half a million of the $17.3 million target for this tax.
- Despite the pending Corporate tax refunds of about $16 million likely to be paid in FY18, corporate profits remain strong and increasingly diverse. The switch to unitary taxation in FY2006 has led to a broader tax base that is less reliant on in-state businesses. While there are still some statutory changes affecting apportionment that could lead to fairer treatment of service-based firms, and probably result in additional revenue, the corporate tax base is now approaching $90 to $100 million per year. Although this could still swing by plus or minus $30-$40 million in any given year, it is a much larger and more stable core tax base than that prior to unitary taxation.
- Personal Income taxes lagged FY17 expectations at the federal level and in many states, due to expectations of possible lower tax rates in tax year 2017 and beyond that led to deferred capital gains realizations in the prior tax year. While this may generate additional revenue in FY18, uncertainty regarding federal tax law changes and the timing and magnitude of any such changes will affect any such rebound. Current projections assume 3.6% growth in FY18 Personal Income revenues and 3.1% growth in FY19. •
- Sales & Use tax revenues were disappointing in FY17, with 1.6% year over year growth – slightly below even the 1.9% rate of inflation over the same period. With several large internet retailers now remitting sales taxes for the first full year in FY18 and enhanced Use tax compliance, Sales & Use receipts could grow by more than 3.5% next year and about 2.5% in FY19. Longer term growth prospects for this large revenue source, however, will still be dampened by both tax avoidance and an aging population that spends more on services than taxable goods.
- Meals & Rooms tax receipts will benefit from this same regional demographic trend, with travel and leisure expenditures increasing as a share of total personal consumption expenditures among older and retired populations. Meals & Rooms revenues have rebounded briskly following the Great Recession in all three northern New England states. Following the worst ski season on record in FY16, Vermont revenues increased by 7.3% in FY17. A “normal” winter weather season in FY18, along with a full year of Airbnb payments, should yield revenue gains of 3.5% or more next year, with similar growth expected in FY19. As shown on the chart below, despite the poor FY16 ski season that drove the NE share of total U.S. visitation to an all-time low, Vermont’s share of the NE market remained above 33%. The recent acquisition of two prominent Vermont ski areas by companies with western ski operations and significant marketing clout could position the State to enhance this share further.
- Bank revenues benefitted from a change in the second half of FY17 that required monthly tax payments instead of quarterly. Confusion in the implementation of this new provision, however, will result in additional revenue in both FY17 and FY18, as not all payers responded to the change and monthly payments for some requires estimation of future credits and liabilities. Offsetting this one-time gain across two fiscal years, are steadily increasing tax expenditures that reduce Bank revenues before they are reported. These “invisible” expenditures have expanded to more than $3.6 million in FY17 and are soon expected to top $4 million per year – more than 35% of all Bank revenues.
- Property Transfer Tax revenues grew at nearly 9% in FY17 and as real estate markets more fully recover, could grow another 5%-8% per year in FY18 and F19. A change in the allocation formula to the General Fund starting in FY18 to support housing bond interest payments, however, will shave nearly $1M per year off reported PTT revenues and Available General Fund revenues. This is yet another example of an increased expenditure embedded as a revenue reduction.
- The Telephone Property tax has been significantly downgraded due to aggressive depreciation being taken by some of the largest payers and statutory ambiguity regarding such depreciation and the applicability of the tax to wireless and VoIP providers. Without statutory clarification, this revenue source will likely be between about $1.5 to $2.5 million per year lower than previously forecast. •
- Transportation Fund revenues ended FY17 about 1.2% below target (-$3.3M), due to much lower than expected yields from recent fee increases and other revenue-enhancement measures, and erratic diesel revenues – which are not unusual. Motor Fuel tax receipts were within about one-half of one percent of targets, as were Motor Vehicle Purchase and Use tax revenues, however, slightly lower future gasoline demand along with continued low gas prices will cause Motor Fuel receipts to decline 0.1% in FY18 and 0.4% in FY19. In no year in the entire forecast period (two years or five) are Transportation Fund revenues expected to even keep pace with inflation.
Source: Kavet, Rockler & Associates of Williamstown 7.21.2017