Vermont Business Magazine Vermont has the second highest percentage of individuals covered by health insurance of any state in the nation and has the second lowest poverty rate. The US Census Bureau has released its most detailed look at America's people, places and economy with new statistics on income, poverty, health insurance and more than 40 other topics from the American Community Survey. Many states saw an increase in income and a decrease in poverty rates between 2014 and 2015. Vermont's houshold income increased 5.1 percent. During that same period, the percentage of people covered by health insurance increased in all of the largest 25 metropolitan areas. The findings are from the US Census Bureau's 2015 American Community Survey, the nation's most comprehensive information source on American households. Today's release provides statistics on more than 40 social, economic and housing topics for US communities with populations of 65,000 or more.
|
Poverty Rates
|
"The American Community Survey allows us to track incremental changes across our nation on how Americans live and work, year-to-year," Census Bureau Director John H Thompson said. "It helps people, businesses and governments in all of our states and local communities better understand the needs of their populations, the markets in which they operate and the challenges and opportunities they face."
Below are some of the local-level income, poverty and health insurance statistics from the American Community Survey that complement the national-level statistics released earlier this week from the Census Bureau'sCurrent Population Survey. The Current Population Survey is the leading source for national-level data, and the American Community Survey is the leading source for community and local-level data. For more information on the topics included in the American Community Survey, ranging from educational attainment to computer use to commuting, please visit census.gov.
Poverty
- Between 2014 and 2015, poverty rates declined in 23 states. No state saw a poverty rate increase.
- Poverty rates in 2015 ranged from a low of 8.2 percent in New Hampshire to a high of 22.0 percent in Mississippi.
- Some of the highest poverty rates were found in Alabama, Arkansas, Kentucky, Louisiana, Mississippi and New Mexico.
- Some of the lowest poverty rates were found in Alaska, Connecticut, Hawaii, Maryland, Minnesota, New Hampshire, New Jersey and Vermont.
- From 2014 to 2015, the poverty rate decreased in 16 of the 25 most populous metropolitan areas. None of the 25 most populous metropolitan areas saw an increase in the poverty rate.
Income
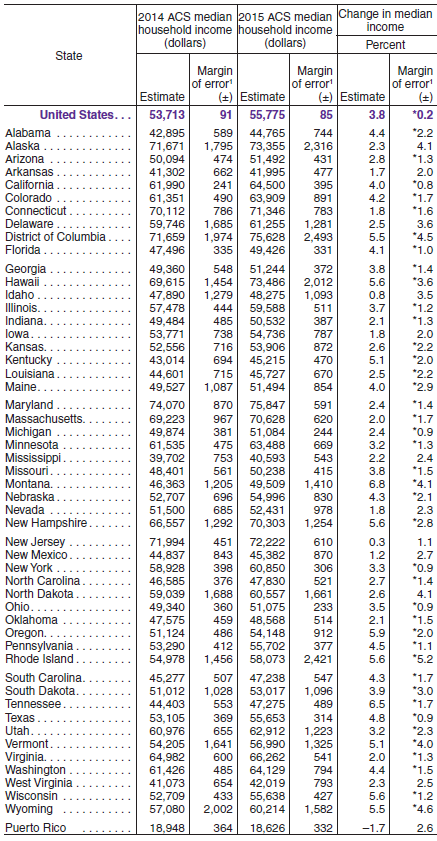
- Real median household income increased in 39 states and the District of Columbia, with increases ranging from 1.8 percent (Connecticut) to 6.8 percent (Montana). No state saw a decrease in median household income between 2014 and 2015. ("Real" refers to income after adjusting for inflation.)
- Maryland ($75,847) and the District of Columbia ($75,628) had median household incomes that were among the highest for 2015. They were not statistically different from each other. The US average was $55,775, up 3.8 percent from 2014. Vermont was $56,990 up 5.1 percent. Mississippi ($40,593) had the lowest, which was statistically unchanged from 2014. Median household income increased in 21 of the 25 most populous metropolitan areas between 2014 and 2015. None of the 25 most populous metropolitan areas showed a decrease.
- Median household income was lower than the U.S. median in 26 states and higher than the U.S. median in 18 states and the District of Columbia.
Income Equality
- The Gini index is a standard economic measure of income inequality. A score of 0.0 is perfect equality in income distribution. A score of 1.0 indicates total inequality where one household has all of the income.
- Five states and the District of Columbia had Gini indices higher than the U.S. rate: California,Connecticut, Florida, Louisiana and New York. Twelve were not statistically different from the U.S. rate; the remaining 33 were lower.
- Most states experienced no statistical change in income inequality. Income inequality increased in eight states (Florida, Illinois, Indiana, Kentucky, Michigan, Nebraska, Nevada and New Jersey) and decreased in one (Connecticut).
Health Insurance
- In 2015, the health insurance coverage rate for the population living inside metropolitan areas was 90.7 percent, which is 2.3 percentage points higher than the rate in 2014.
- In 2015, the Boston metropolitan area had the highest health insurance coverage rate (97.0 percent) among the most populous 25 metropolitan areas, and the Houston metropolitan area had the lowest rate (82.7 percent).
- Between 2014 and 2015, the percentage of people covered by health insurance increased in all 25 of the most populous 25 metropolitan areas. The change in the rate of coverage ranged from 0.8 percentage points to 5.2 percentage points.
- Between 2013 and 2015, Miami, Los Angeles and Riverside metropolitan areas experienced the largest increase in the rate of health insurance coverage among the most populous metropolitan areas. Their rates of health insurance coverage increased by about 9.0 percentage points.
Additional Topics and Findings Released Today From the American Community Survey:
Living Arrangements of Adults
Based on data user requests, a new data table (B09021) provides statistics on the living arrangements of adults in the United States. Several findings are highlighted below:
- Nationally in 2015, 34.1 percent of 18- to 34-year-olds in households lived in their parents' home.
- At the state level, New Jersey had the highest percentage of 18- to 34-year-olds in households living in their parents' home (46.9 percent). Connecticut (41.6 percent) and New York (40.6 percent), which did not differ statistically from each other, had the next highest percentages.
- North Dakota had the lowest percentage of 18- to 34-year-olds in households living in their parents' home (14.1 percent) followed by the District of Columbia (16.6 percent).
New: Citizen Voting-Age Population Statistics Added to Data Profile Table
Based on data user requests, estimates of the citizen, voting-age population, available in Detailed Table (B05003), are now included in the Data Profile table on Demographic and Housing Statistics (DP05).
|
Health insurance rank by total not covered in thousands and %
|
Additional Annual Releases:
- The Census Bureau also released the 2015 American Community Survey statistics today on itsapplication programming interface.
Upcoming: 2011-2015 American Community Survey 5-Year Statistics
On Dec. 8, the Census Bureau will release 2011-2015 American Community Survey 5-year statistics, which are available for all geographic areas regardless of population size, down to the block group level. A media embargo begins Dec. 6. A prerelease technical webinar will take place prior to the release.
About the American Community Survey
The American Community Survey provides a wide range of important statistics about all communities in the United States. The American Community Survey gives communities the current information they need to plan investments and services. Retailers, homebuilders, fire departments, and town and city planners are among the many private- and public-sector decision makers who count on these annual results. Visit the Stats in Action page to see some examples.
These statistics would not be possible without the participation of the randomly selected households throughout the country in the survey.
SEE MEDIAN HOUSEHOLD INCOME TABLE BELOW

SOURCE WASHINGTON, Sept. 15, 2016 /PRNewswire-USNewswire/ -- US Census Bureau