Vermont Business Magazine With all the major indicators suggesting a strong trend, the Vermont Department of Labor announced today that the seasonally-adjusted statewide unemployment rate for April was 3.2 percent. This represents a decrease of one-tenth of one percentage point from the revised March rate (3.3 percent). The number of employed and the labor force were up versus both the previous month and the previous year and the number of unemployed was down versus both time indicators. The national rate in April was 5.0 percent. Overall, Vermont’s unemployment rate was tied for fifth lowest in the country for April. South Dakota (2.5 percent) and New Hampshire (2.6 percent) remained first and second. Alaska and Illinois tied for last at 6.6 percent. As of the prior month’s initial data, the Burlington-South Burlington Metropolitan NECTA, at 2.6 percent, had the third lowest unemployment rate in the country for all metropolitan areas. See tables below.
April is the ninth consecutive month reporting a decline to the number of unemployed persons in Vermont (seasonally-adjusted).
Governor Shumlin said: "This is continued good news for Vermont. Since 2011, Vermont employers have added 18,000 jobs. That growth has been aided by our efforts to spur economic development in various industries, including the renewable energy sector. Just this week we learned that Vermont has the highest per capita employment rate when it comes to clean energy jobs. Add to that the fact that for each year since 2011, Vermonters' incomes have gone up at or faster than the national average - something that has never happened before. We've done all that while making smart policy choices that protect workers, such as ensuring paid sick days and raising the minimum wage. For anyone who says growing jobs and doing what is right for workers are incompatible goals, Vermont's continued economic success proves them wrong."
Labor Commissioner Annie Noonan said: “Vermont has seen a continued decrease in the number of unemployed persons; nearly a 1,600 person drop in the past 12 months - not associated with claimants exhausting benefits or becoming ‘discouraged workers’ (i.e. stopping work search activities). At the current time, many national economists are predicting growth for at least the next twelve months. Even so, we continue to see some layoff activity around the state and in various occupational sectors, which may be expected seasonal or unexpected downsizings.
 "The Department of Labor’s services for job seekers include skill assessment, career guidance, labor market information, skill and job training, and matching job seekers and businesses. We sponsor Apprenticeship programs, Work Opportunity Tax Credits, On the Job Training contracts with employers, hiring events and job fairs, applicant screening and referrals, and many other services for businesses. We work with great training and education providers who can help bridge skill gaps for people who are struggling to get hired or advance in their careers.
"As we move into the end of the school year, the Department is trying to target and message to our graduating high school and college students and other recent graduates, that Vermont has many employment opportunities. We want them to connect with us to participate in internships, job training or full-time jobs. Vermont employers have job openings at all levels, and are anxious to hire people who are motivated, have a good attitude and work ethic.
"Visit one of the Vermont Department of Labor’s 12 regional career center offices and talk to our job counselors about your career needs and goals.”
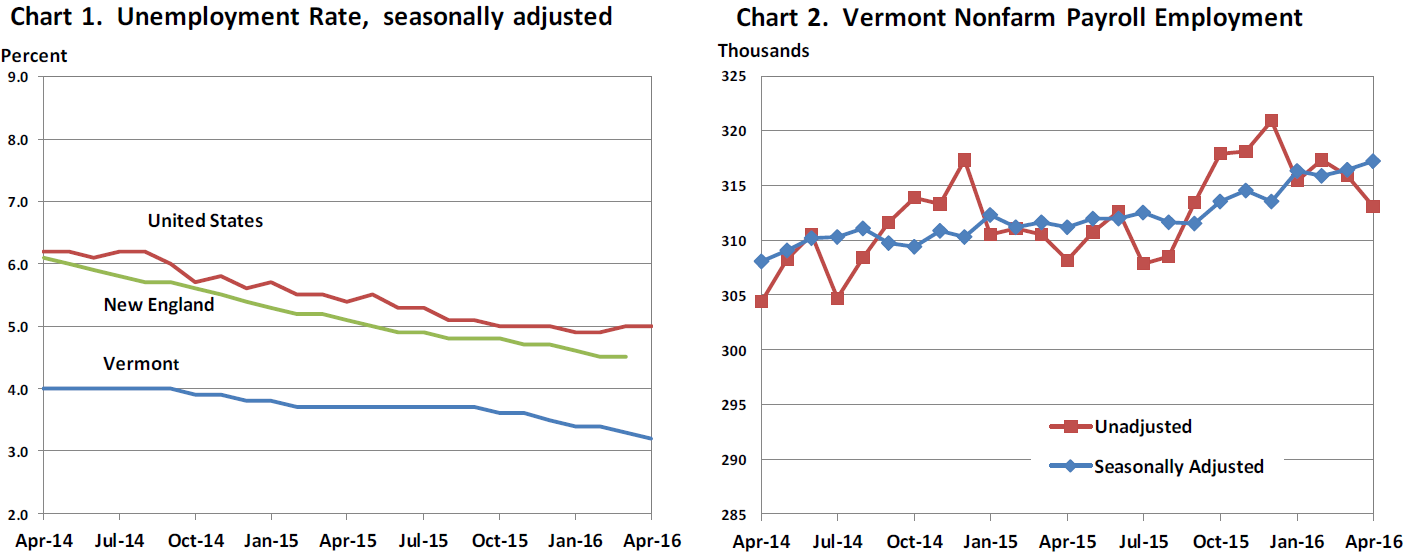
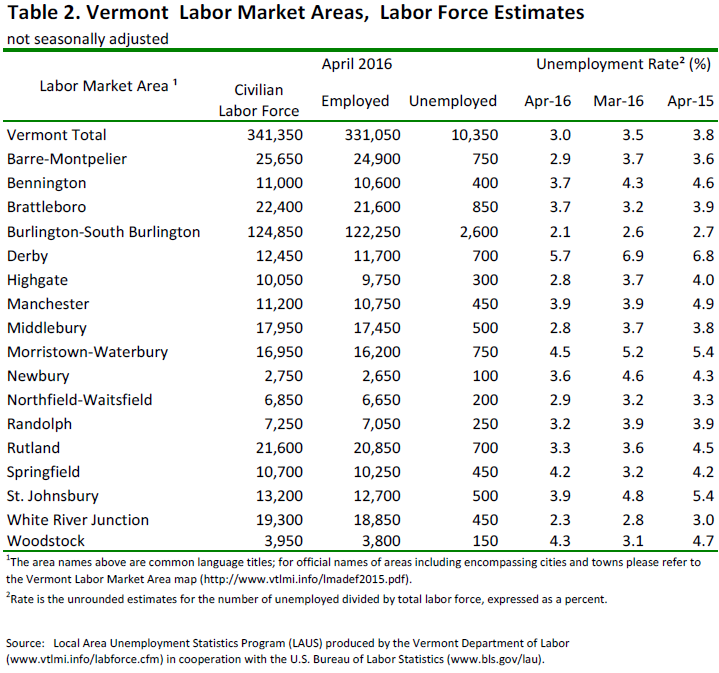
The Vermont seasonally-adjusted unemployment rate declined by one-tenth of one percentage point in April to a statewide average of 3.2 percent. The United States rate is 5.0 percent which experienced no change compared to the revised March estimate. The seasonally-adjusted Vermont data for April show the Vermont civilian labor force increased by 800 from the prior month’s revised estimate. The number of employed increased by 1,250 and the number of unemployed decreased by 450. The over-the-month changes to the number of unemployed and the unemployment rate were statistically significant in the seasonally-adjusted series.
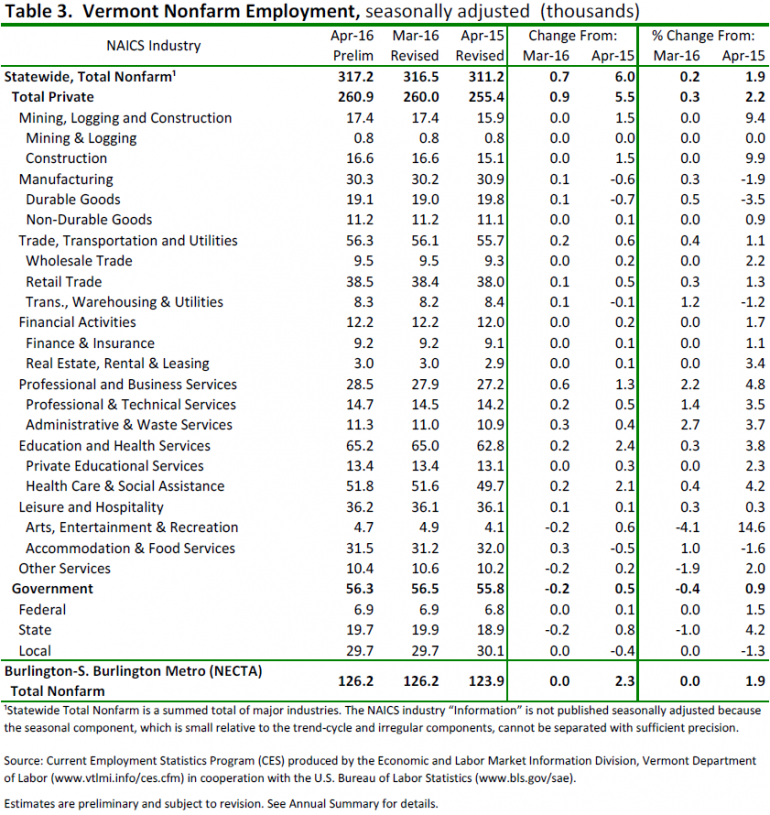
The April unemployment rates for Vermont’s 17 labor market areas ranged from 2.1 percent in Burlington-South Burlington to 5.7 percent in Derby (note: local labor market area unemployment rates are not seasonally-adjusted). For comparison, the April unadjusted unemployment rate for Vermont was 3.0 percent which reflects a decrease of five-tenths of one percentage point from the revised unadjusted March level and a decrease of eight-tenths of one percentage point from a year ago.
Not-Seasonally-Adjusted
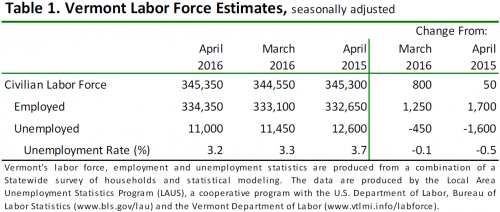
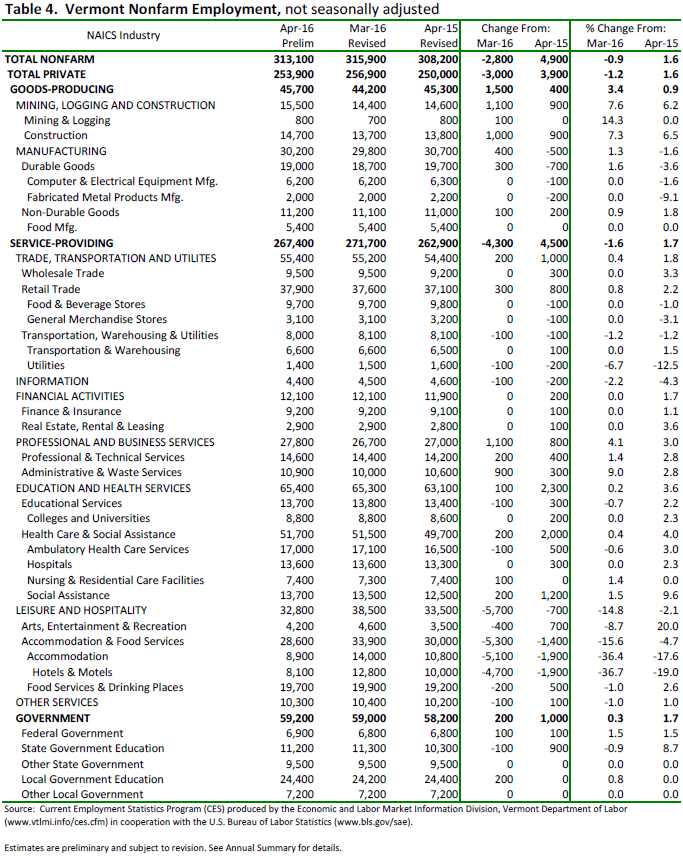
The preliminary ‘not-seasonally-adjusted’ jobs estimates for April show a decrease of 2,800 jobs when compared to the revised March numbers. There was an increase of 400 jobs between the preliminary and the revised March estimates due to the inclusion of more data. The monthly decrease seen in the April numbers was attributable to the end of the winter season and its impact on leisure and hospitality employment. The broader economic trends can be detected by focusing on the over-the-year changes in this data series. As detailed in the preliminary ‘not-seasonally adjusted’ April data, Total Private industries have increased by 3,900 jobs (1.6 percent) and Government (including public education) employment has increased by 1,000 jobs (1.7 percent) in the past year.
Seasonally-Adjusted
The seasonally-adjusted data for April reports an increase of 700 jobs from the revised March data. As with the ‘not-seasonally-adjusted’ data, this over-the-month change is from the revised March numbers which experienced a 400 job increase from the preliminary estimates. The seasonally-adjusted over-the-month changes in April were predominately positive at the sectorial level. Those with a notable percent increase include: Administrative & Waste Services (+300 jobs or +2.7%), Professional and Technical Services (+200 jobs or +1.4%), and Accommodation and Food Services (+300 jobs or +1.0%). Industries with a notable percent decrease include: Arts, Entertainment & Recreation (-200 jobs or -4.1%), Other Services (-200 jobs or -1.9%), and State Government (-200 jobs or -1.0%).
NOTE: Employment (nonfarm payroll) - A count of all persons who worked full- or part-time or received pay from a nonagricultural employer for any part of the pay period which included the 12th of the month. Because this count comes from a survey of employers, persons who work for two different companies would be counted twice. Therefore, nonfarm payroll employment is really a count of the number of jobs, rather than the number of persons employed. Persons may receive pay from a job if they are temporarily absent due to illness, bad weather, vacation, or labor-management dispute. This count is based on where the jobs are located, regardless of where the workers reside, and is therefore sometimes referred to as employment "by place of work." Nonfarm payroll employment data are collected and compiled based on the Current Employment Statistics (CES) survey, conducted by the Vermont Department of Labor. This count was formerly referred to as nonagricultural wage and salary employment.
| Rank | State | April 2016 |
March 2016 |
Change |
| 1 | SOUTH DAKOTA | 2.5 | 2.5 | 0.0 |
| 2 | NEW HAMPSHIRE | 2.6 | 2.6 | 0.0 |
| 3 | NEBRASKA | 3.0 | 3.0 | 0.0 |
| 4 | COLORADO | 3.1 | 2.9 | 0.2 |
| 5 | HAWAII | 3.2 | 3.1 | 0.1 |
| 5 | NORTH DAKOTA | 3.2 | 3.1 | 0.1 |
| 5 | VERMONT | 3.2 | 3.3 | -0.1 |
| 8 | MAINE | 3.4 | 3.4 | 0.0 |
| 9 | IDAHO | 3.7 | 3.8 | -0.1 |
| 9 | UTAH | 3.7 | 3.5 | 0.2 |
| 11 | KANSAS | 3.8 | 3.9 | -0.1 |
| 11 | MINNESOTA | 3.8 | 3.8 | 0.0 |
| 13 | ARKANSAS | 3.9 | 4.1 | -0.2 |
| 13 | IOWA | 3.9 | 3.8 | 0.1 |
| 13 | VIRGINIA | 3.9 | 4.0 | -0.1 |
| 16 | DELAWARE | 4.2 | 4.4 | -0.2 |
| 16 | MASSACHUSETTS | 4.2 | 4.4 | -0.2 |
| 16 | MONTANA | 4.2 | 4.3 | -0.1 |
| 19 | MISSOURI | 4.3 | 4.2 | 0.1 |
| 19 | TENNESSEE | 4.3 | 4.5 | -0.2 |
| 21 | TEXAS | 4.4 | 4.3 | 0.1 |
| 21 | WISCONSIN | 4.4 | 4.5 | -0.1 |
| 23 | OKLAHOMA | 4.5 | 4.4 | 0.1 |
| 23 | OREGON | 4.5 | 4.5 | 0.0 |
| 25 | MARYLAND | 4.6 | 4.7 | -0.1 |
| 26 | NEW JERSEY | 4.7 | 4.4 | 0.3 |
| 27 | FLORIDA | 4.8 | 4.9 | -0.1 |
| 27 | MICHIGAN | 4.8 | 4.8 | 0.0 |
| 29 | NEW YORK | 4.9 | 4.8 | 0.1 |
| 30 | INDIANA | 5.2 | 5.0 | 0.2 |
| 30 | OHIO | 5.2 | 5.1 | 0.1 |
| 32 | CALIFORNIA | 5.3 | 5.4 | -0.1 |
| 32 | KENTUCKY | 5.3 | 5.6 | -0.3 |
| 32 | PENNSYLVANIA | 5.3 | 4.9 | 0.4 |
| 32 | RHODE ISLAND | 5.3 | 5.4 | -0.1 |
| 36 | NORTH CAROLINA | 5.4 | 5.5 | -0.1 |
| 37 | ARIZONA | 5.5 | 5.4 | 0.1 |
| 37 | GEORGIA | 5.5 | 5.5 | 0.0 |
| 37 | WYOMING | 5.5 | 5.2 | 0.3 |
| 40 | CONNECTICUT | 5.7 | 5.7 | 0.0 |
| 41 | NEVADA | 5.8 | 5.8 | 0.0 |
| 41 | SOUTH CAROLINA | 5.8 | 5.7 | 0.1 |
| 41 | WASHINGTON | 5.8 | 5.8 | 0.0 |
| 44 | MISSISSIPPI | 6.0 | 6.3 | -0.3 |
| 45 | ALABAMA | 6.1 | 6.2 | -0.1 |
| 46 | NEW MEXICO | 6.2 | 6.2 | 0.0 |
| 47 | LOUISIANA | 6.3 | 6.1 | 0.2 |
| 48 | DISTRICT OF COLUMBIA | 6.4 | 6.5 | -0.1 |
| 48 | WEST VIRGINIA | 6.4 | 6.5 | -0.1 |
| 50 | ALASKA | 6.6 | 6.6 | 0.0 |
| 50 | ILLINOIS | 6.6 | 6.5 | 0.1 |
NOTE: Data refer to place of residence. All estimates are provisional and will be revised when new benchmark and population information becomes available.
Source: Bureau of Labor Statistics