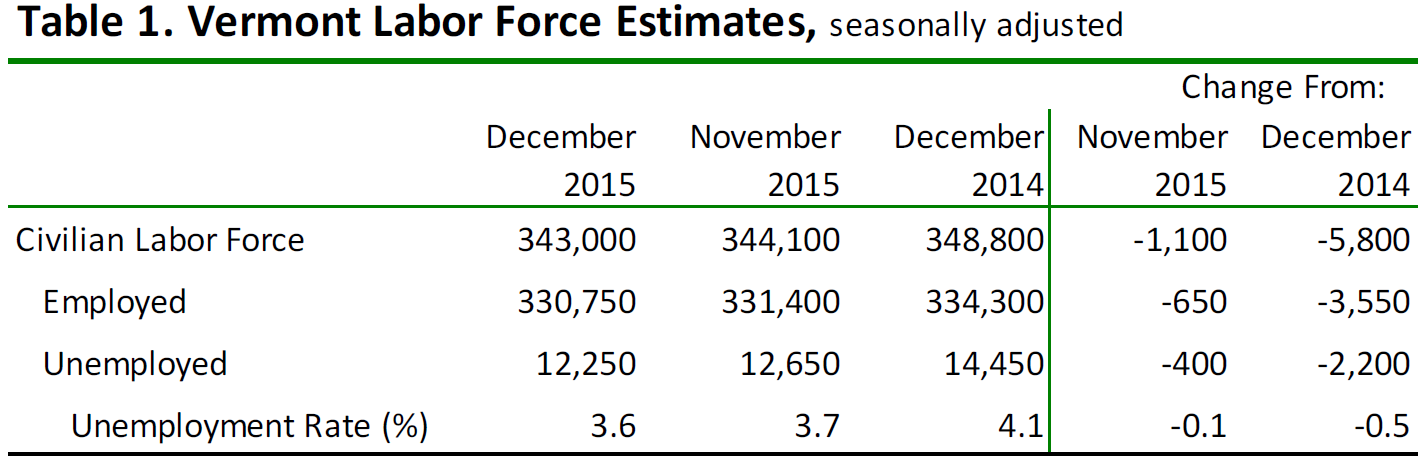
by Timothy McQuiston Vermont Business Magazine The Vermont seasonally-adjusted unemployment rate fell one-tenth in December to 3.6 percent, the first time the rate has fallen since last April, when it fell two-tenths to 3.6 percent. The crucial numbers continue to show a falling Labor Force and number of Employed, as tourism hiring lagged with the slow start to the ski season. However, the number of Unemployed also fell, causing the rate to go down. The Vermont Department of Labor announced the results today. The national average in December held at 5.0 percent. Vermont’s unemployment rate was again tenth lowest in the country. North Dakota was lowest at 2.7 percent and New Mexico was highest at 6.7 percent. Based on preliminary 2015 data, eleven of twelve months during the calendar year were below four percent unemployment generating a preliminary seasonally-adjusted annual average Vermont statewide unemployment rate of 3.7 percent.
 “The lack of snow directly impacted the number of jobs in Vermont in December. People who had been hired by employers in the leisure and hospitality sector were laid off when the snow didn’t arrive as expected, and ski lifts were idled, hotel rooms weren’t booked, and restaurants weren’t serving the winter-season visitors. As such, the December employment data had notable employment loss; fortunately, the situation is turning around, and many of those laid off workers are now back to work. Vermont employers are still hiring, and job training programs and internships are available for many Vermonters. The Department of Labor encourages anyone looking for work or a career change to visit one of our 12 regional career centers”, said Labor Commissioner Annie Noonan.
The seasonally-adjusted Vermont data for December show the Vermont civilian labor force decreased by 1,100 from the prior month’s estimate. The number of employed decreased by 650 and the number of unemployed decreased by 400. The over-the-month change to the number of unemployed was statistically significant in the seasonally-adjusted series.
The December unemployment rates for Vermont’s 17 labor market areas ranged from 2.3 percent in White River Junction to 5.6 percent in Derby (note: local labor market area unemployment rates are not seasonally-adjusted). For comparison, the December unadjusted unemployment rate for Vermont was 3.1 percent which reflects a decrease of four-tenths of a percentage point from the revised unadjusted November level and a decrease of seven-tenths of a percentage point from a year ago.
The preliminary ‘not-seasonally-adjusted’ jobs estimates for December show an increase of 2,900 jobs when compared to the revised November numbers. There was a decrease of 100 jobs between the preliminary and the revised November estimates due to the inclusion of more data.
The monthly increase seen in the December numbers was attributable to seasonal increases related to Leisure and Hospitality. The broader economic trends can be detected by focusing on the over-the-year changes in this data series. As detailed in the preliminary ‘not-seasonally-adjusted’ December data, Total Private industries have increased by 1,900 jobs (0.7 percent) and Government employment has increased by 1,000 jobs (1.7 percent) in the past year.
The seasonally-adjusted data for December reports a decrease of 2,100 jobs from the revised November data. As with the ‘not-seasonally-adjusted’ data, this over-the-month change is from the revised November numbers which experienced a 100 job decrease from the preliminary estimates.
The seasonally-adjusted over-the-month changes in December were minor at the sectorial level. Those with a notable percent change include: Leisure & Hospitality (-2,200 jobs or -5.7%) and Construction (+500 jobs or +3.4%). All other sectorial movements were plus or minus 100 jobs.


| Unemployment Rates for States Monthly Rankings Seasonally Adjusted Dec. 2015p |
||
|---|---|---|
| Rank | State | Rate |
| 1 | NORTH DAKOTA | 2.7 |
| 2 | NEBRASKA | 2.9 |
| 2 | SOUTH DAKOTA | 2.9 |
| 4 | NEW HAMPSHIRE | 3.1 |
| 5 | HAWAII | 3.2 |
| 6 | IOWA | 3.4 |
| 7 | COLORADO | 3.5 |
| 7 | MINNESOTA | 3.5 |
| 7 | UTAH | 3.5 |
| 10 | VERMONT | 3.6 |
| 11 | IDAHO | 3.9 |
| 11 | KANSAS | 3.9 |
| 13 | MAINE | 4.0 |
| 13 | MONTANA | 4.0 |
| 15 | OKLAHOMA | 4.1 |
| 16 | VIRGINIA | 4.2 |
| 17 | WISCONSIN | 4.3 |
| 17 | WYOMING | 4.3 |
| 19 | INDIANA | 4.4 |
| 19 | MISSOURI | 4.4 |
| 21 | MASSACHUSETTS | 4.7 |
| 21 | OHIO | 4.7 |
| 21 | TEXAS | 4.7 |
| 24 | ARKANSAS | 4.8 |
| 24 | NEW YORK | 4.8 |
| 24 | PENNSYLVANIA | 4.8 |
| 27 | DELAWARE | 5.0 |
| 27 | FLORIDA | 5.0 |
| 29 | MARYLAND | 5.1 |
| 29 | MICHIGAN | 5.1 |
| 29 | NEW JERSEY | 5.1 |
| 29 | RHODE ISLAND | 5.1 |
| 33 | CONNECTICUT | 5.2 |
| 34 | KENTUCKY | 5.3 |
| 35 | OREGON | 5.4 |
| 36 | GEORGIA | 5.5 |
| 36 | SOUTH CAROLINA | 5.5 |
| 36 | WASHINGTON | 5.5 |
| 39 | NORTH CAROLINA | 5.6 |
| 39 | TENNESSEE | 5.6 |
| 41 | ARIZONA | 5.8 |
| 41 | CALIFORNIA | 5.8 |
| 43 | ILLINOIS | 5.9 |
| 44 | LOUISIANA | 6.1 |
| 45 | ALABAMA | 6.2 |
| 46 | WEST VIRGINIA | 6.3 |
| 47 | MISSISSIPPI | 6.4 |
| 47 | NEVADA | 6.4 |
| 49 | ALASKA | 6.5 |
| 50 | DISTRICT OF COLUMBIA | 6.6 |
| 51 | NEW MEXICO | 6.7 |
p = preliminary.
NOTE: Rates shown are a percentage of the labor force. Data refer to place of residence. Estimates for the current month are subject to revision the following month.