HNI Corporation(NYSE: HNI), the new parent company of Vermont Castings, today announced sales for the fourth quarter endedJanuary 3, 2015, of$646.7 millionand net income of$7.1 million, or$0.16per diluted share. Non-GAAP net income per diluted share improved 30 percent from the prior year quarter to$0.65, which excludes restructuring charges, goodwill and intangible impairment, transition costs and gain on sale of assets.
For fiscal year 2014, the Corporation reported sales of$2.2 billionand net income of$61.5 million, or$1.35per diluted share. Non-GAAP net income per diluted share improved 38 percent from the prior year to $1.97, which excludes restructuring charges, goodwill and intangible impairment, transition costs and gains on sale of assets. HNI acquired Vermont Castings last fall.
RELATED:HNI Corporation acquires Vermont Castings
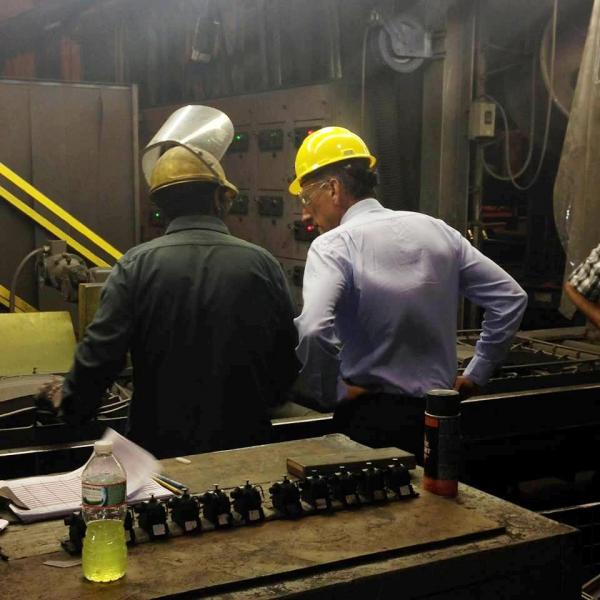 Governor Shumlin at Vermont Castings last fall. Courtesy photo.
Fourth Quarter and Year End Summary Comments
"We are pleased with our very strong sales and earnings for the fourth quarter and full year 2014. Our hearth business achieved record financial results for the year, driven by four consecutive quarters of double-digit growth in both new construction and remodel/retrofit channels and strong operational execution. Office furniture sales momentum accelerated in the fourth quarter with significant increases in both our supplies-driven and contract businesses. We enter 2015 financially strong, competitively well positioned and focused on delivering profitable growth," saidStan Askren, HNI Corporation Chairman, President and Chief Executive Officer.
|
Fourth Quarter – Financial Performance (Dollars in millions, except per share data) |
|||
| Three Months Ended | |||
| 1/3/2015 | 12/28/2013 | Change | |
| GAAP | |||
| Net Sales | $646.7 | $541.3 | 19.5% |
| Gross Profit % | 35.3% | 35.7% | -40 bps |
| SG&A % | 28.2% | 28.7% | -50 bps |
| (Gain) loss on sale of assets % | (0.2%) | - | 20 bps |
| Restructuring & impairment charges % | 3.4% | - | 340 bps |
| Operating Income | $24.8 | $37.6 | -34.1% |
| Operating Income % | 3.8% | 7.0% | -320 bps |
| Net Income % | 1.1% | 4.2% | -310 bps |
| EPS – diluted | $0.16 | $0.50 | -68.0% |
| Non-GAAP | |||
| Gross Profit % | 35.7% | 35.7% | - |
| Operating Income | $48.4 | $37.7 | 28.2% |
| Operating Income % | 7.5% | 7.0% | 50 bps |
| EPS - diluted | $0.65 | $0.50 | 30.0% |
Fourth Quarter Summary Comments
- Consolidated net sales increased$105.4 millionor 19.5 percent to$646.7 million. Compared to prior year quarter, an acquisition, net of divestiture, increased sales$24.4 million. On an organic basis sales increased 15.0 percent.
- Non-GAAP gross margin was consistent with prior year. Higher volume and better price realization were offset by unfavorable product mix and investments in operations.
- Selling and administrative expenses, as a percentage of sales, decreased 50 basis points due to volume, partially offset by increased freight costs due to carrier capacity constraints, strategic investments, higher incentive-based compensation and acquisition impact.
- The Corporation recorded$24.5 millionof restructuring and impairment charges and transition costs. These charges included goodwill and intangible impairment charges of$20.5 millionrelated to a small office furniture business and$4.0 millionof restructuring and transition costs in connection with closures announced earlier this year. Of the restructuring and transition charges,$2.7 millionwas included in cost of sales.
- The effective tax rate for the current year quarter of 69.3 percent reflects the non-deductibility of the goodwill and intangible impairment. Excluding this impact the effective tax rate was 36.7 percent.
|
Full Year – Financial Performance (Dollars in millions, except per share data) |
|||
| Twelve Months Ended | |||
| 1/3/2015 | 12/28/2013 | Change | |
| GAAP | |||
| Net Sales | $2,222.7 | $2,060.0 | 7.9% |
| Gross Profit % | 35.3% | 34.7% | 60 bps |
| SG&A % | 29.2% | 29.4% | -20 bps |
| (Gain) loss on sale of assets % | (0.5%) | 0.1% | 60 bps |
| Restructuring & impairment charges % | 1.5% | - | 150 bps |
| Operating Income | $112.8 | $106.0 | 6.5% |
| Operating Income % | 5.1% | 5.1% | - |
| Net Income % | 2.8% | 3.1% | -30 bps |
| EPS – diluted | $1.35 | $1.39 | -2.9% |
| Non-GAAP | |||
| Gross Profit % | 35.7% | 34.7% | 100 bps |
| Operating Income | $145.3 | $108.8 | 33.5% |
| Operating Income % | 6.5% | 5.3% | 120 bps |
| EPS - diluted | $1.97 | $1.43 | 37.8% |
Full Year Summary Comments
- Consolidated net sales increased$162.7 millionor 7.9 percent to$2.2 billion. Compared to prior year, an acquisition, net of divestitures, increased sales$7.5 million. On an organic basis sales increased 7.5 percent.
- Non-GAAP gross margin improved 100 basis points from prior year primarily due to higher volume, better price realization and strong operational performance, partially offset by unfavorable product mix, investments in operations and higher warranty costs.
- Selling and administrative expenses, as a percentage of sales, decreased 20 basis points due to volume, partially offset by increased freight costs due to carrier capacity constraints, strategic investments, increased group medical costs, higher incentive-based compensation and acquisition impact.
- The Corporation recorded$43.1 millionof restructuring and impairment charges and transition costs. These charges included goodwill and intangible impairment charges of$29.4 millionrelated to two office furniture businesses and$13.7 millionof restructuring and transition costs in connection with closures announced during this year. Of the restructuring and transition charges,$10.1 millionwas included in cost of sales.
- The effective tax rate for the current year of 41.6 percent reflects the non-deductibility of the goodwill and intangible impairment recorded in the fourth quarter. Excluding this impact the effective tax rate was 34.8 percent.
|
Office Furniture – Financial Performance (Dollars in millions) |
||||||
| Three Months Ended | Twelve Months Ended | |||||
| 1/3/2015 | 12/28/2013 | Change | 1/3/2015 | 12/28/2013 | Change | |
| GAAP | ||||||
| Net Sales | $468.6 | $417.0 | 12.4% | $1,739.0 | $1,685.2 | 3.2% |
| Operating Income | $9.6 | $25.8 | -62.9% | $87.1 | $97.3 | -10.6% |
| Operating Income % | 2.0% | 6.2% | -420 bps | 5.0% | 5.8% | -80 bps |
| Non-GAAP | ||||||
| Operating Income | $33.1 | $25.9 | 27.8% | $120.8 | $100.1 | 20.6% |
| Operating Income % | 7.1% | 6.2% | 90 bps | 6.9% | 5.9% | 100 bps |
- Fourth quarter sales increased$51.7 millionor 12.4 percent to$468.6 million. Compared to prior year quarter, divestitures reduced sales by$0.7 million. On an organic basis, sales increased 12.6 percent. Full year sales increased$53.8 millionor 3.2 percent to$1.74 billion. Compared to prior year, divestitures reduced sales by$17.7 million. On an organic basis, sales increased 4.2 percent. The increase in sales for the quarter and the year were driven by growth in the supplies-driven and contract channels.
- Fourth quarter non-GAAP operating profit increased$7.2 millionor 27.8 percent. Full year non-GAAP operating profit increased$20.7 millionor 20.6 percent. Increased volume, higher price realization and strong operational performance were partially offset by unfavorable mix, investments in operations, increased freight costs due to carrier capacity constraints and increased incentive-based compensation.
|
Hearth Products – Financial Performance (Dollars in millions) |
||||||
| Three Months Ended | Twelve Months Ended | |||||
| 1/3/2015 | 12/28/2013 | Change | 1/3/2015 | 12/28/2013 | Change | |
| GAAP | ||||||
| Net Sales | $178.0 | $124.3 | 43.2% | $483.6 | $374.8 | 29.1% |
| Operating Income | $33.1 | $23.0 | 44.1% | $77.1 | $46.7 | 65.2% |
| Operating Income % | 18.6% | 18.5% | 10 bps | 15.9% | 12.5% | 340 bps |
- Fourth quarter sales increased$53.7 millionor 43.2 percent to$178.0 million. Full year sales increased$108.9 millionor 29.1 percent to$483.6 million. Compared to prior year for the quarter and full year, acquisitions increased sales by$25.2 million. On an organic basis, sales increased 23.0 percent for the quarter and 22.3 percent for the full year driven by increases in both the new construction and the remodel/retrofit channel.
- For the quarter, operating profit increased$10.1 millionor 44.1 percent due to increased volume, higher price realization and the impact of the acquisition partially offset by higher material costs and strategic investments. Full year operating profit increased$30.4 millionor 65.2 percent due to increased volume, higher price realization and the impact of the acquisition partially offset by increased material costs, higher warranty expense and increased incentive-based compensation.
Outlook
"We enter 2015 with strong momentum and will continue to drive long-term shareholder value creation," said Mr. Askren.
The Corporation estimates sales to be up 17 to 21 percent in the first quarter over the same period in the prior year, including sales from the Vermont Castings Group acquisition. Non-GAAP earnings per share are anticipated in the range of$0.18 to $0.23for the first quarter and$2.45 to $2.65for the full year, which includes the Vermont Castings Group acquisition results and excludes restructuring and impairment charges, transition costs and gain/loss on sale of assets.
|
HNI CORPORATION Unaudited Condensed Consolidated Statement of Operations |
|||||
| Three Months Ended | Twelve Months Ended | ||||
| (Dollars in thousands, except per share data) | 1/3/2015 | 12/28/2013 | 1/3/2015 | 12/28/2013 | |
| Net Sales | $646,661 | $541,263 | $2,222,695 | $2,059,964 | |
| Cost of products sold | 418,698 | 348,282 | 1,438,495 | 1,344,672 | |
| Gross profit | 227,963 | 192,981 | 784,200 | 715,292 | |
| Selling and administrative expenses | 182,341 | 155,237 | 649,055 | 606,512 | |
| (Gain) loss on sale of assets | (977) | - | (10,723) | 2,460 | |
| Restructuring and impairment charges | 21,778 | 97 | 33,019 | 333 | |
| Operating income | 24,821 | 37,647 | 112,849 | 105,987 | |
| Interest income | 92 | 158 | 418 | 626 | |
| Interest expense | 1,976 | 1,687 | 8,336 | 9,906 | |
| Income before income taxes | 22,937 | 36,118 | 104,931 | 96,707 | |
| Income taxes | 15,959 | 13,376 | 43,776 | 33,338 | |
| Net income | 6,978 | 22,742 | 61,155 | 63,369 | |
| Less: Net (loss) attributable to the noncontrolling interest | (104) | (18) | (316) | (314) | |
| Net income attributable to HNI Corporation | $7,082 | $22,760 | $61,471 | $63,683 | |
| Net income attributable to HNI Corporation common shareholders – basic | $0.16 | $0.50 | $1.37 | $1.41 | |
| Average number of common shares outstanding – basic | 44,324,249 | 45,117,315 | 44,759,716 | 45,250,665 | |
| Net income attributable to HNI Corporation common shareholders – diluted | $0.16 | $0.50 | $1.35 | $1.39 | |
| Average number of common shares outstanding – diluted | 45,202,346 | 45,964,128 | 45,578,872 | 45,956,280 | |
| Unaudited Condensed Consolidated Balance Sheet | ||||||
| Assets | Liabilities and Shareholders' Equity | |||||
| (Dollars in thousands) | As of | As of | ||||
| 1/3/2015 | 12/28/2013 | 1/3/2015 | 12/28/2013 | |||
| Cash and cash equivalents | $34,144 | $65,030 | Accounts payable and | |||
| Short-term investments | 3,052 | 7,251 | accrued expenses | $453,754 | $407,799 | |
| Receivables | 240,053 | 228,715 | Note payable and current | |||
| Inventories | 121,791 | 89,516 | maturities of long-term debt | 160 | 484 | |
| Deferred income taxes | 17,310 | 16,051 | Current maturities of other | |||
| Prepaid expenses and | long-term obligations | 3,419 | 3,301 | |||
| other current assets | 39,209 | 26,665 | ||||
| Current assets | 455,559 | 433,228 | Current liabilities | 457,333 | 411,584 | |
| Long-term debt | 197,736 | 150,091 | ||||
| Capital lease obligations | 106 | |||||
| Other long-term liabilities | 80,353 | 67,543 | ||||
| Property and equipment – net | 311,008 | 267,401 | Deferred income taxes | 89,411 | 68,964 | |
| Goodwill | 279,310 | 286,655 | ||||
| Other assets | 193,457 | 147,421 | Parent Company shareholders' | |||
| equity | 414,587 | 436,328 | ||||
| Noncontrolling interest | (86) | 89 | ||||
| Shareholders' equity | 414,501 | 436,417 | ||||
| Total liabilities and | ||||||
| Total assets | $1,239,334 | $1,134,705 | shareholders' equity | $1,239,334 | $1,134,705 | |
| Unaudited Condensed Consolidated Statement of Cash Flows | ||
| Twelve Months Ended | ||
| (Dollars in thousands) | 1/3/2015 | 12/28/2013 |
| Net cash flows from (to) operating activities | $167,796 | $165,002 |
| Net cash flows from (to) investing activities: | ||
| Capital expenditures | (112,713) | (78,895) |
| Other | (41,497) | 3,476 |
| Net cash flows from (to) financing activities | (44,472) | (66,335) |
| Net increase (decrease) in cash and cash equivalents | (30,886) | 23,248 |
| Cash and cash equivalents at beginning of period | 65,030 | 41,782 |
| Cash and cash equivalents at end of period | $34,144 | $65,030 |
| Business Segment Data | |||||
| Three Months Ended | Twelve Months Ended | ||||
| (Dollars in thousands) | 1/3/2015 | 12/28/2013 | 1/3/2015 | 12/28/2013 | |
| Net sales: | |||||
| Office furniture | $468,645 | $416,991 | $1,739,049 | $1,685,205 | |
| Hearth products | 178,016 | 124,272 | 483,646 | 374,759 | |
| $646,661 | $541,263 | $2,222,695 | $2,059,964 | ||
| Operating profit: | |||||
| Office furniture | $9,565 | $25,816 | $87,053 | $97,339 | |
| Hearth products | 33,092 | 22,963 | 77,066 | 46,662 | |
| Total operating profit | 42,657 | 48,779 | 164,119 | 144,001 | |
| Unallocated corporate expense | (19,720) | (12,661) | (59,188) | (47,294) | |
| Income before income taxes | $22,937 | $36,118 | $104,931 | $96,707 | |
| Depreciation and amortization expense: | |||||
| Office furniture | $11,493 | $9,608 | $45,891 | $36,992 | |
| Hearth products | 1,960 | 1,249 | 5,415 | 5,288 | |
| General corporate | 1,505 | 1,194 | 5,416 | 4,341 | |
| $14,958 | $12,051 | $56,722 | $46,621 | ||
| Capital expenditures (including capitalized software): | |||||
| Office furniture | $19,318 | $12,552 | $62,696 | $51,954 | |
| Hearth products | 1,953 | 652 | 6,342 | 4,220 | |
| General corporate | 9,694 | 6,102 | 43,675 | 22,721 | |
| $30,965 | $19,306 | $112,713 | $78,895 | ||
|
As of 1/3/2015 |
As of 12/28/2013 |
||||
| Identifiable assets: | |||||
| Office furniture | $724,293 | $722,697 | |||
| Hearth products | 341,315 | 255,978 | |||
| General corporate | 173,726 | 156,030 | |||
| $1,239,334 | $1,134,705 | ||||
|
HNI Corporation Reconciliation (Dollars in millions, except per share data) |
|||||||||||
| Three Months Ended 1/3/2015 | Three Months Ended 12/28/2013 | ||||||||||
| Gross Profit |
Operating Income |
EPS |
Gross Profit |
Operating Income |
EPS |
||||||
| As Reported (GAAP) | $228.0 | $24.8 | $0.16 | $193.0 | $37.6 | $0.50 | |||||
| % of net sales | 35.3% | 3.8% | 35.7% | 7.0% | |||||||
| Restructuring and Impairment | $0.2 | $22.0 | $0.47 | - | $0.1 | $0.00 | |||||
| Transition costs | $2.5 | $2.5 | $0.03 | - | - | - | |||||
| (Gain) loss on sale of assets | - | ($1.0) | ($0.01) | - | - | - | |||||
| Results (non-GAAP) | $230.7 | $48.4 | $0.65 | $193.0 | $37.7 | $0.50 | |||||
| % of net sales | 35.7% | 7.5% | 35.7% | 7.0% | |||||||
| Twelve Months Ended 1/3/2015 | Twelve Months Ended 12/28/2013 | ||||||||||
| Gross Profit |
Operating Income |
EPS |
Gross Profit |
Operating Income |
EPS |
||||||
| As Reported (GAAP) | $784.2 | $112.8 | $1.35 | $715.3 | $106.0 | $1.39 | |||||
| % of net sales | 35.3% | 5.1% | 34.7% | 5.1% | |||||||
| Restructuring and Impairment | $5.2 | $38.2 | $0.70 | - | $0.3 | $0.01 | |||||
| Transition costs | $4.9 | $4.9 | $0.07 | - | - | - | |||||
| (Gain) loss on sale of assets | - | ($10.7) | ($0.15) | - | $2.5 | $0.03 | |||||
| Results (non-GAAP) | $794.3 | $145.3 | $1.97 | $715.3 | $108.8 | $1.43 | |||||
| % of net sales | 35.7% | 6.5% | 34.7% | 5.3% | |||||||
|
Effective Tax Rate Reconciliation (Dollars in millions) |
|||||||||||
| Three Months Ended 1/3/2015 | Twelve Months Ended 1/3/2015 | ||||||||||
| Taxable Income |
Tax Expense |
Effective Tax Rate |
Taxable Income |
Tax Expense |
Effective Tax Rate |
||||||
| Income before tax (including non-controlling interest) | $23.0 | $16.0 | 69.3% | $105.2 | $43.8 | 41.6% | |||||
| Non-deductible impairments | $20.5 | - | $20.5 | - | |||||||
| Adjusted income before tax (including non-controlling interest) |
$43.5 |
$16.0 |
36.7% |
$125.7 |
$43.8 |
34.8% |
|||||
|
Office Furniture Reconciliation (Dollars in millions) |
|||||||||||
| Three Months Ended | Percent Change |
Twelve Months Ended | Percent Change |
||||||||
| 1/3/2015 | 12/28/2013 | 1/3/2015 | 12/28/2013 | ||||||||
| Operating profit as reported (GAAP) | $9.6 | $25.8 | -62.9% | $87.1 | $97.3 | -10.6% | |||||
| % of Net Sales | 2.0% | 6.2% | 5.0% | 5.8% | |||||||
| Restructuring and Impairment | $22.0 | $0.1 | $38.2 | $0.3 | |||||||
| Transition Costs | $2.5 | - | $4.9 | - | |||||||
| (Gain) Loss on Sale of Assets | ($1.0) | - | ($9.4) | $2.5 | |||||||
| Operating profit (non-GAAP) | $33.1 | $25.9 | 27.8% | $120.8 | $100.1 | 20.6% | |||||
| % of Net Sales | 7.1% | 6.2% | 6.9% | 5.9% | |||||||
Non-GAAP Financial Measures
This earnings release contains certain non-GAAP financial measures. A "non-GAAP financial measure" is a numerical measure of a company's financial performance that excludes or includes amounts different than the most directly comparable measure calculated and presented in accordance with GAAP in the statements of income, balance sheets or statements of cash flow of the company. We have provided a reconciliation of non-GAAP financial measures to the most directly comparable GAAP financial measure.
The non-GAAP financial measures used within this earnings release are: gross profit, operating income, operating profit, net income per diluted share (i.e., EPS), excluding restructuring and impairment charges, transition costs, gain/loss on sale, and effective tax rate excluding non-deductible goodwill and intangible impairment charges. Non-GAAP EPS is calculated using the Corporation's overall effective tax rate for the period adjusted for non-deductible goodwill and intangible impairment deductions. We present these measures because management uses this information to monitor and evaluate financial results and trends. Management believes this information is also useful for investors. This earnings release also contains a forward-looking estimate of non-GAAP earnings per diluted share for the first quarter and full fiscal year 2015. We provide such non-GAAP measures to investors on a prospective basis for the same reasons we provide them to investors on a historical basis. We are unable to provide a reconciliation of our forward-looking estimate of non-GAAP earnings per diluted share to a forward-looking estimate of GAAP earnings per diluted share because certain information needed to make a reasonable forward-looking estimate of GAAP earnings per diluted share for the first quarter and full fiscal year is difficult to predict and estimate and is often dependent on future events which may be uncertain or outside of our control. These may include unanticipated charges related to asset impairments (fixed assets, intangibles or goodwill), unanticipated acquisition related costs and other unanticipated non-recurring items not reflective of ongoing operations.
Conference Call
HNI Corporation will host a conference call onThursday, February 12, 2015at10:00 a.m.(Central) to discuss fourth quarter and fiscal year 2014 results. To participate, call 1-877-512-9166 – conference ID number 64115968. A live webcast of the call will be available on HNI Corporation's website athttp://www.hnicorp.com(under Investor Information – Webcasts). A replay of the webcast will be made available at the website address above. An audio replay of the call will be available untilThursday, February 19, 2015,10:59 p.m.(Central) by dialing 1-855-859-2056 or 1-404-537-3406 – Conference ID number 64115968.
About HNI Corporation
HNI Corporation is a NYSE traded company (ticker symbol: HNI) providing products and solutions for the home and workplace environments. HNI Corporation is a leading global office furniture manufacturer and is the nation's leading manufacturer of hearth products. The Corporation's strong brands have leading positions in their markets. More information can be found on the Corporation's website atwww.hnicorp.com.
Forward-looking Statements
This release contains "forward-looking" statements based on current expectations regarding future plans, events, outlook, objectives and financial performance, expectations for future sales growth and earnings per diluted share (GAAP and non-GAAP) for the fourth quarter and full year fiscal 2014. Forward-looking statements can be identified by words including "expect," "believe," "anticipate," "estimate," "may," "will," "would," "could," "confident" or other similar words, phrases or expressions. Forward-looking statements involve known and unknown risks and uncertainties, which may cause the Corporation's actual future results and performance to differ materially from expected results. These risks include but are not limited to: general economic conditions inthe United Statesand internationally; unfavorable changes inthe United Stateshousing market; industry and competitive conditions; a decline in corporate spending on office furniture; changes in raw material, component or commodity pricing; future acquisitions, divestitures or investments; the cost of energy; changing legal, regulatory, environmental and healthcare conditions; the Corporation's ability to successfully complete its business software system implementation; the Corporation's ability to implement price increases; changes in the sales mix of products; and force majeure events outside the Corporation's control. A description of these risks and additional risks can be found in the Corporation's annual and quarterly reports filed with the Securities and Exchange Commission on Forms 10-K and 10-Q. The Corporation undertakes no obligation to update, amend or clarify forward-looking statements.
For Information Contact:
Matthew D. McGough, Vice President, Corporate Finance (563) 272-7563
Kurt A. Tjaden, Vice President and Chief Financial Officer (563) 272-7400
SOURCE: MUSCATINE, Iowa,Feb. 11, 2015/PRNewswire/ --HNI Corporation