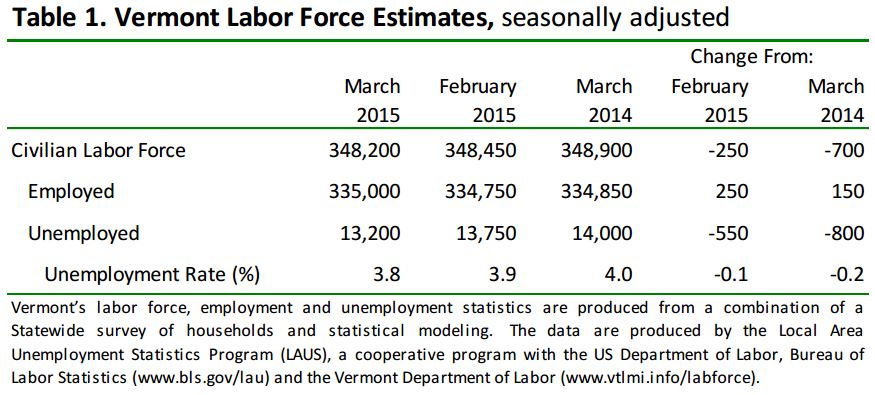
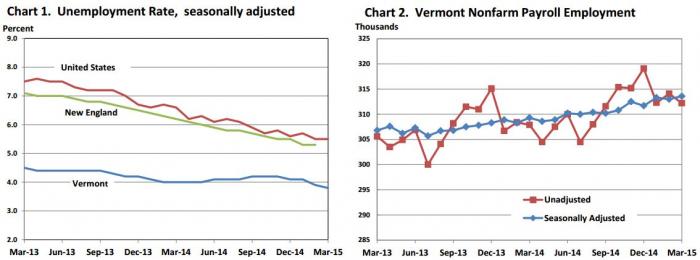
The Vermont Department of Labor announced today that the seasonally-adjusted statewide unemployment rate for March was 3.8 percent. This represents a decrease of one-tenth of a percent from the revised February rate (3.9 percent). The national average in March was 5.5 percent, which experienced no change from the previous month’s estimate. Vermont’s unemployment rate was lowest in the East andagain tied for sixth lowest in the country. March represents the sixth consecutive month without an increase to the unemployment rate.
SEE TABLES BELOW: By Vermont Labor Market Area, By Industry, By State
“Vermont's economy was bolstered by a successful 2014-2015 ski season, as evidenced by the year over year comparisons within the Leisure and Hospitality sector measurements. We are focusing on the new seasonal job opportunities in this sector, and in Construction and Manufacturing. The Department of Labor is working on several initiatives to connect veterans, dislocated and trade adjusted workers, and long-term unemployed to training programs that guarantee jobs at the end of the training. We are working with well-known employers who are hiring. Some of these initiatives include pre-apprentice and apprenticeships, industry credentialing, and federally-funded On-the-Job Trainings (OJTs). The best way for job seekers to learn more about these and other programs is to visit with staff in one of our 12 regional career resource centers. There are many employers who are in need of workers, and it is often a matter of having assistance in making the connection with the right person within the organization, which the Department can facilitate", said Annie Noonan, Commissioner of Labor.
 The seasonally adjusted Vermont data for March show the Vermont civilian labor force decreased by 250 from the prior month estimates. The number of employed increased by 250 and the number of unemployed decreased by 550. The over-the-month changes to the number of unemployed and the unemployment rate were statistically significant in the seasonally-adjusted series.
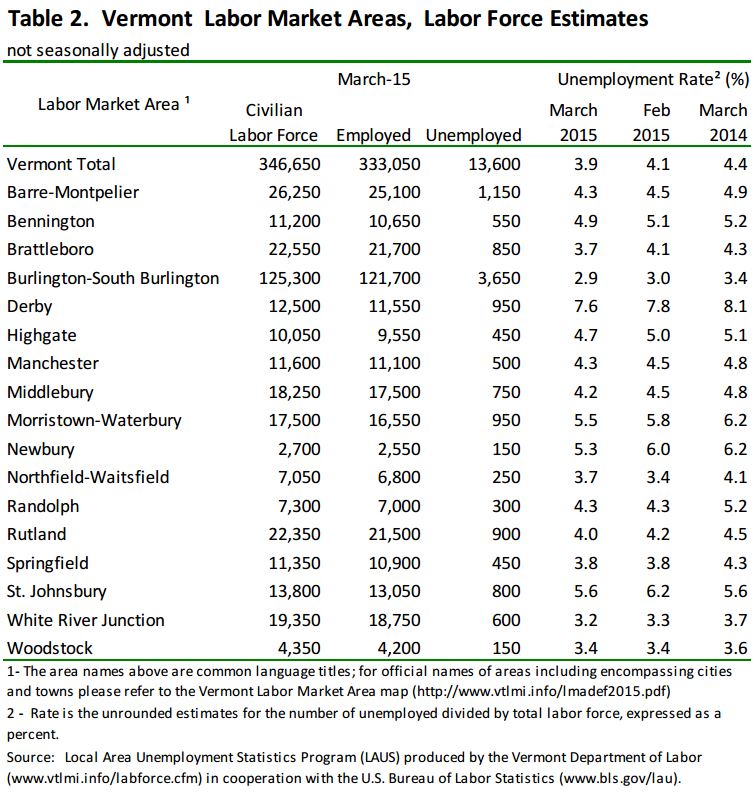
March unemployment rates for Vermont’s 17 labor market areas ranged from 2.9 in BurlingtonSouth Burlington to 7.6 in Derby (note: local labor market area unemployment rates are not seasonally adjusted). For comparison, the March unadjusted unemployment rate for Vermont was 3.9 percent which reflects a decrease of two-tenths of a percent from the revised February level and a decrease of five-tenths of a percent from a year ago.
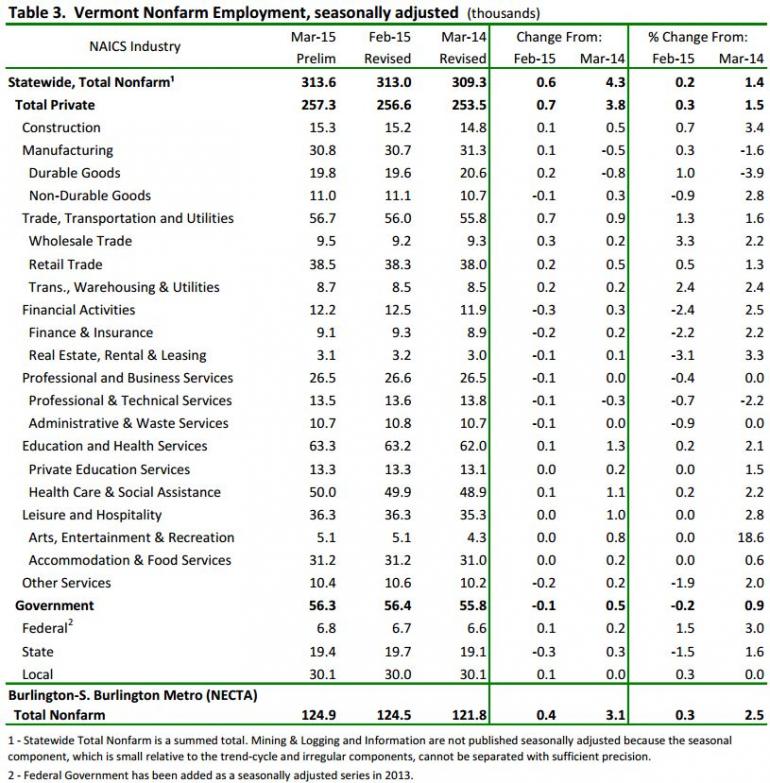
The preliminary ‘not-seasonally-adjusted’ jobs estimates for March show a decrease of 1,900 jobs when compared to the revised February numbers. There was an increase of 300 jobs between the preliminary and the revised February estimates due to the inclusion of more data. The monthly decrease seen in the March numbers was attributable to seasonal decreases related to leisure and hospitality. The broader economic trends can be detected by focusing on the over-the-year changes in this data series. As detailed in the preliminary ‘not-seasonally-adjusted’ March data.Total Private industries have increased by 3,800 jobs (1.5 percent) and Government employment increased by 500 jobs (0.9 percent) in the past year.
The seasonally adjusted data for March reports an increase of 600 jobs from the revised February data. As with the ‘not-seasonally-adjusted’ data, this over-the-month change is from the revised February numbers which experienced a 300 job increase from the preliminary estimates.
The seasonally adjusted over-the-month changes in March were varied at the sectorial level. Those with a notable percent increase include: Trade, Transportation, and Utilities (+700 jobs or +1.3%) and Construction (+100 jobs or +0.7%). Industries with a notable percent decrease include: Financial Activities (-300 jobs or -2.4%) and Other Services (-200 jobs or -1.9%).
Unemployment Rates for States
| Unemployment Rates for States Monthly Rankings Seasonally Adjusted Mar. 2015p |
||
|---|---|---|
| Rank | State | Rate |
| 1 | NEBRASKA | 2.6 |
| 2 | NORTH DAKOTA | 3.1 |
| 3 | UTAH | 3.4 |
| 4 | SOUTH DAKOTA | 3.5 |
| 5 | MINNESOTA | 3.7 |
| 6 | IDAHO | 3.8 |
| 6 | VERMONT | 3.8 |
| 8 | NEW HAMPSHIRE | 3.9 |
| 8 | OKLAHOMA | 3.9 |
| 10 | IOWA | 4.0 |
| 11 | HAWAII | 4.1 |
| 11 | MONTANA | 4.1 |
| 11 | WYOMING | 4.1 |
| 14 | COLORADO | 4.2 |
| 14 | KANSAS | 4.2 |
| 14 | TEXAS | 4.2 |
| 17 | DELAWARE | 4.6 |
| 17 | WISCONSIN | 4.6 |
| 19 | MAINE | 4.8 |
| 19 | MASSACHUSETTS | 4.8 |
| 19 | VIRGINIA | 4.8 |
| 22 | KENTUCKY | 5.1 |
| 22 | OHIO | 5.1 |
| 24 | PENNSYLVANIA | 5.3 |
| 25 | MARYLAND | 5.4 |
| 25 | NORTH CAROLINA | 5.4 |
| 25 | OREGON | 5.4 |
| 28 | ARKANSAS | 5.6 |
| 28 | MICHIGAN | 5.6 |
| 28 | MISSOURI | 5.6 |
| 31 | ALABAMA | 5.7 |
| 31 | FLORIDA | 5.7 |
| 31 | NEW YORK | 5.7 |
| 34 | INDIANA | 5.8 |
| 35 | WASHINGTON | 5.9 |
| 36 | ILLINOIS | 6.0 |
| 37 | NEW MEXICO | 6.1 |
| 38 | ARIZONA | 6.2 |
| 39 | GEORGIA | 6.3 |
| 39 | RHODE ISLAND | 6.3 |
| 39 | TENNESSEE | 6.3 |
| 42 | CONNECTICUT | 6.4 |
| 43 | ALASKA | 6.5 |
| 43 | CALIFORNIA | 6.5 |
| 43 | NEW JERSEY | 6.5 |
| 46 | LOUISIANA | 6.6 |
| 46 | WEST VIRGINIA | 6.6 |
| 48 | SOUTH CAROLINA | 6.7 |
| 49 | MISSISSIPPI | 6.8 |
| 50 | NEVADA | 7.1 |
| 51 | DISTRICT OF COLUMBIA | 7.7 |
p= preliminary.
NOTE: Rates shown are a percentage of the labor force. Data refer to place of residence. Estimates for the current month are subject to revision the following month.