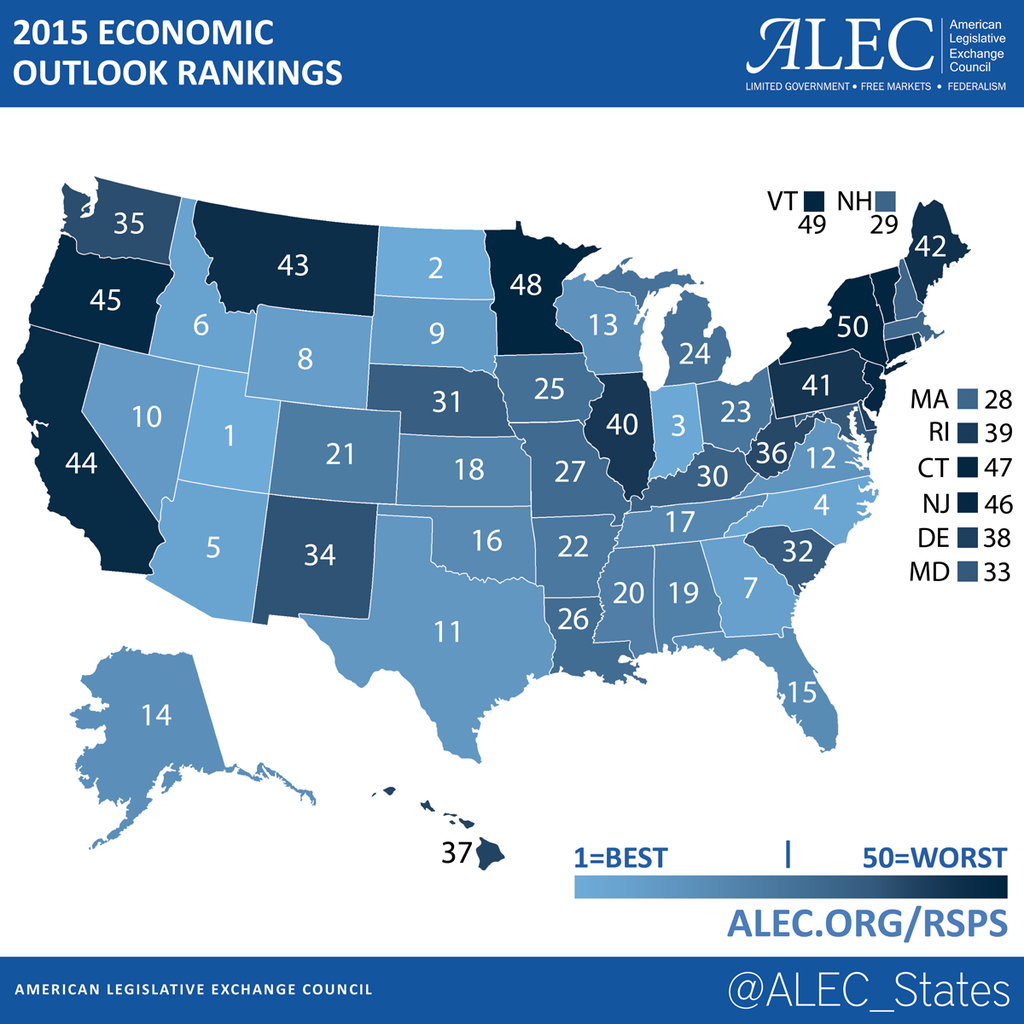
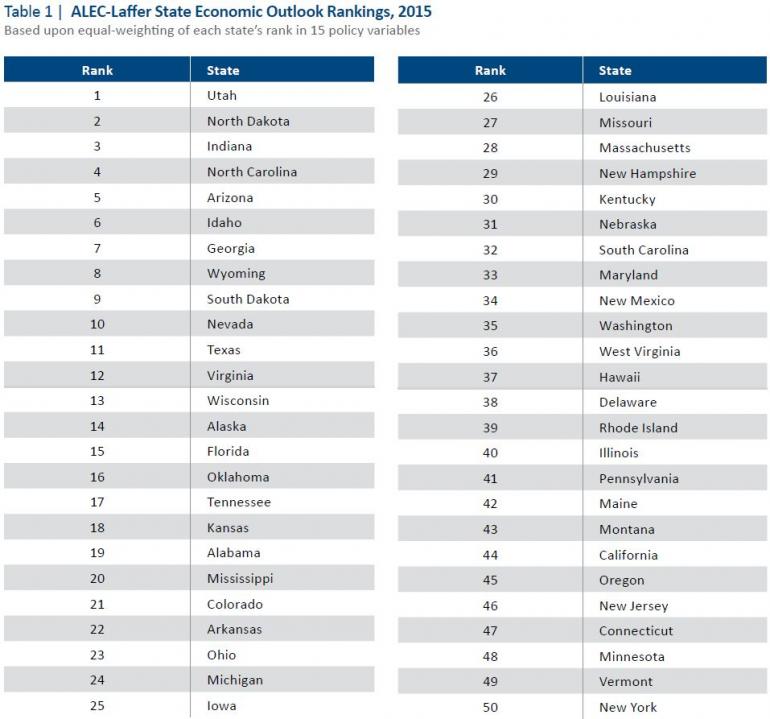
Utah again garnered the top spot for states with the best economic outlook, followed by North Dakota, Indiana, North Carolina and Arizona, according to the newest edition of Rich States, Poor States released Wednesday by the American Legislative Exchange Council (ALEC). Vermont once again finished 49th, just ahead of New York. In the "performance" aspect of the report, Vermont finished 38th, down two spots. The report is authored by Reagan-era economist Dr Arthur B Laffer.
With much of the ranking predicated on tax policy, Vermont has predictably finished near or at the bottom. In the eights years of the study, Vermont has not finished higher than 49th and has been 50th twice. While ranking low for all the income and propety tax questions, Vermont was 7th best in sales tax and 5th in debt service.
See data tables below.
The 15 economic policy variables used by the authors to rank the economic outlook of states have shown over time to be among the most influential variables for state growth, according to the report.
The report is not predictive of actual "richness" of the population, such as Median Household Income, where Utah is 13th and Vermont is 18th. Several of the wealthier states, such as Connecticut and New Jersey, had low ALEC scores, while some with relatively low incomes also had low ALEC scores, such as Montana and West Virginia.
The top ten and bottom ten states for 2015 are:
|
Overall Economic Outlook for 2015
|
||||||||
While Vermont stayed put, the report revealed many states significantly improved or fell in the rankings. Kentucky was the biggest winner in the rankings this year and improved by nine spots. Illinois came in second for largest improvements by climbing eight spots, while Oklahoma improved by five spots and Wisconsin by four spots. On the other hand, Michigan was the biggest loser this year and fell in the rankings by 12 spots. Delaware fell 11 spots, Pennsylvania fell eight spots, and South Dakota fell seven spots.
“The big story this year is the bipartisan embrace of state tax cuts,” said Jonathan Williams, Vice President of the ALEC Center for State Fiscal Reform and co-author of Rich States, Poor States: ALEC-Laffer State Economic Competitiveness Index. “States are increasingly realizing the need to become more competitive through fiscal responsibility and free market economic reforms. We anticipate 2015 will be a record year for pro-growth tax reform.”
Rich States, Poor States examines the latest trends in state economic growth. The data ranks the 2015 economic outlook of states using 15 equally weighted policy variables, including various tax rates, regulatory burdens and labor policies. The eighth edition examines trends over the last few decades that have helped or hurt states’ economies.

 Median Household Income
| Maryland | $69,826 |
| New Hampshire | 69,453 |
| Connecticut | 66,905 |
| Virginia | 66,015 |
| New Jersey | 64,670 |
| Massachusetts | 64,373 |
| Alaska | 61,731 |
| District of Columbia | 61,365 |
| Minnesota | 61,162 |
| Colorado | 60,727 |
| Washington | 60,692 |
| Hawaii | 59,882 |
| Utah | 59,877 |
| California | 56,883 |
| Wyoming | 56,835 |
| North Dakota | 55,946 |
| Rhode Island | 55,159 |
| Vermont | 54,982 |
| Nebraska | 54,777 |
| Wisconsin | 54,342 |
| Oregon | 54,067 |
| Illinois | 54,044 |
| Iowa | 53,696 |
| Delaware | 52,839 |
| Pennsylvania | 52,768 |
| Texas | 52,169 |
| New York | 51,554 |
| South Dakota | 51,165 |
| Maine | 50,487 |
| Michigan | 50,056 |
| Kansas | 50,003 |
| Idaho | 49,847 |
| Arizona | 49,562 |
| Missouri | 49,403 |
| Georgia | 47,958 |
| Indiana | 47,805 |
| Oklahoma | 47,691 |
| Nevada | 47,371 |
| Florida | 47,114 |
| Ohio | 45,887 |
| Montana | 43,864 |
| South Carolina | 43,437 |
| North Carolina | 43,395 |
| Tennessee | 43,303 |
| New Mexico | 43,221 |
| Alabama | 43,196 |
| West Virginia | 42,581 |
| Kentucky | 41,707 |
| Arkansas | 40,760 |
| Louisiana | 40,462 |
| Mississippi | 40,194 |
ABOVE: Median Household Income (In 2013 Inflation-adjusted Dollars) by State Ranked from Highest to Lowest Using 3-Year Average: 2011-2013, US CENSUS. Ranked from Highest to Lowest Using 3-Year-Average Medians
Used by state lawmakers across America since 2008, Rich States, Poor States: ALEC-Laffer State Economic Competitiveness Index, is authored by economist Dr. Arthur B. Laffer, Heritage Foundation Chief Economist Stephen Moore, and Jonathan Williams, Vice President of the American Legislative Exchange Council Center for State Fiscal Reform.
Source: Arlington, VA (April 8, 2015)—American Legislative Exchange Council is the largest nonpartisan, voluntary membership organization of state legislators in the United States. The Council is governed by state legislators who comprise the Board of Directors and is advised by the Private Enterprise Advisory Council, a group of private, foundation and think tank members. For more information about the American Legislative Exchange Council, please visit: www.alec.org. www.alec.org/rsps.