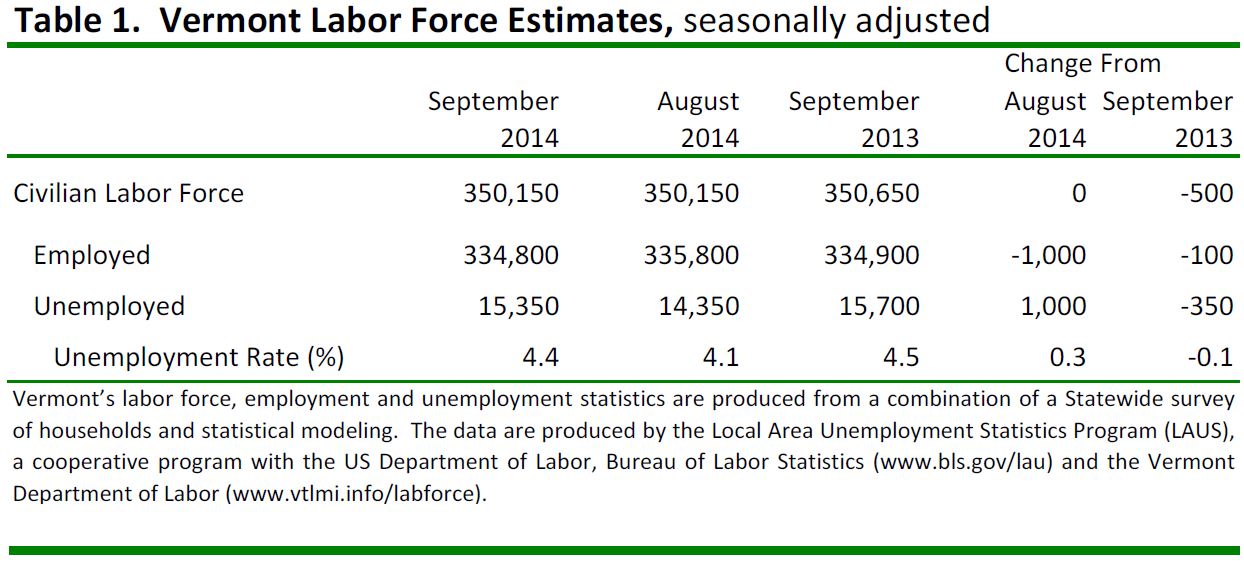
Vermont Unemployment Rate Rises to 4.4 percent in September The Vermont Department of Labor announced today that the seasonally-adjusted statewide unemployment rate for September 2014 was 4.4 percent. This represents an increase of three-tenths of a percent from the revised August rate (4.1 percent). The increase was driven by both an increase in the number of unemployed and a decrease in the number of employed. The equivalent national average was 5.9 percent, which decreased by two-tenths of a percent from the previous month’s estimate. This is the fourth monthly increase to the statewide unemployment rate in Vermont in the past year. Vermont ranks seventh nationally and is no longer the lowest in New England, as New Hampshire's rate fell to 4.3 percent.
“The rate is trending similar to last summer/early fall where Vermont saw a few months of increases that eventually leveled out and then trended downward. Even with this slight increase, Vermont still ranks among the lowest unemployment states in the nation. Over the last year, Vermont has added 1,500 private sector jobs including gains in Construction, Manufacturing, and Professional & Technical Services. At 4.4 percent, Vermont’s unemployment rate remains well below the national average of 5.9%. In addition, the news of Global Foundries (GF) acquiring the semiconductor manufacturing operations from IBM, and that GF is committed to Vermont, is very positive news for the workers, for the supporting communities, and for our state. It helps to reduce some of the anxiety that has been present and which may have been hampering the ongoing economic recovery. The Vermont Department of Labor continues to provide services to all Vermonters seeking employment, training and new career options, and many programs to help employers with recruitment services, job training and development. Call or stop by one of the VDOL’s 12 regional offices to learn more about our services”, said Labor Commissioner Annie Noonan.
The seasonally adjusted Vermont data for September show the Vermont civilian labor did not change relative to August. The number of employed decreased by 1,000 and the number of unemployed increased by 1,000. The over-the-month changes to the number unemployed and the unemployment rate were statistically significant in the seasonally-adjusted series.
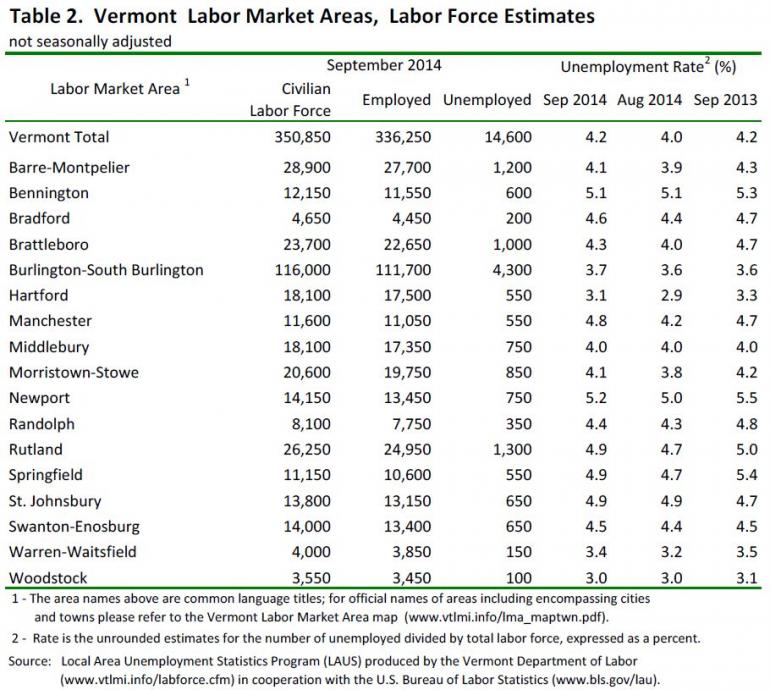
September unemployment rates for Vermont’s 17 labor market areas ranged from 3.0 percent in Woodstock to 5.2 percent in Newport (note: local labor market area unemployment rates are not seasonally adjusted). For comparison, the September unadjusted unemployment rate for Vermont was 4.2 percent which reflects a two-tenths percent increase from the revised August level and no change from a year ago.
Not Seasonally Adjusted
The preliminary ‘not-seasonally-adjusted’ jobs estimates for September show an increase of 5,800 jobs when compared to the revised August numbers. This reported over-the-month change does not include the 100 job increase between the preliminary and the revised August estimates due to the inclusion of more data. The monthly increase seen in the September numbers was attributable to seasonal increases related to education. The broader economic trends can be detected by focusing on the over-the-year changes in this data series. As detailed in the preliminary ‘notseasonally-adjusted’ September data, Total Private industries have increased by 0.5 percent (1,300 jobs) and Government employment has decreased by 1.4 percent (-800 jobs).
Seasonally Adjusted
The seasonally adjusted data for September reports a decrease of 700 jobs from the revised August data. This over-the-month change is from the revised August numbers which experienced a 100 job increase from the preliminary estimates. The seasonally adjusted over-the-month changes in September were minor at the sectorial level. Those with a notable percent increase include: Leisure and Hospitality (+1,000 jobs or 3.0%) and Other Services (+100 jobs or 1.0%). Industries with a notable percent decrease include: Private Education Services (-500 jobs or -3.7%), Total Government (-800 jobs or -1.5%), and Construction (-200 jobs or -1.4%).
|
|||||


| Current Unemployment Rates for States and Historical Highs/Lows Seasonally Adjusted |
|||||
|---|---|---|---|---|---|
| Sept. 2014p | Historical High | Historical Low | |||
| State | Rate | Date | Rate | Date | Rate |
| Alabama | 6.6 | Dec. 1982 | 14.3 | Apr. 2007 | 3.2 |
| Alaska | 6.8 | June 1986 | 11.5 | Apr. 2007 | 5.9 |
| Arizona | 6.9 | Jan. 1983 | 11.6 | July 2007 | 3.5 |
| Arkansas | 6.2 | July 1983 | 10.1 | Nov. 2000 | 4.0 |
| California | 7.3 | Oct. 2010 | 12.4 | Jan. 2001 | 4.7 |
| Colorado | 4.7 | Oct. 2010 | 9.1 | Jan. 2001 | 2.6 |
| Connecticut | 6.4 | Nov. 2010 | 9.5 | Oct. 2000 | 2.1 |
| Delaware | 6.5 | Dec. 1976 | 9.3 | Feb. 1989 | 2.8 |
| District of Columbia | 7.7 | Feb. 1983 | 11.6 | May 1989 | 4.8 |
| Florida | 6.1 | Mar. 2010 | 11.4 | Aug. 2006 | 3.3 |
| Georgia | 7.9 | Jan. 2010 | 10.4 | Dec. 2000 | 3.3 |
| Hawaii | 4.2 | Jan. 1976 | 9.9 | Dec. 2006 | 2.3 |
| Idaho | 4.5 | Feb. 1983 | 9.6 | Mar. 2007 | 2.7 |
| Illinois | 6.6 | Feb. 1983 | 12.9 | Feb. 1999 | 4.2 |
| Indiana | 5.7 | Jan. 1983 | 12.7 | Apr. 1999 | 2.6 |
| Iowa | 4.6 | Mar. 1983 | 8.6 | Oct. 1999 | 2.5 |
| Kansas | 4.8 | Aug. 2009 | 7.5 | Apr. 1979 | 3.0 |
| Kentucky | 6.7 | Jan. 1983 | 12.0 | June 2000 | 4.1 |
| Louisiana | 6.0 | Nov. 1986 | 12.8 | July 2006 | 3.6 |
| Maine | 5.8 | Jan. 1977 | 9.0 | Jan. 2001 | 3.1 |
| Maryland | 6.3 | Nov. 1982 | 8.4 | Feb. 2008 | 3.3 |
| Massachusetts | 6.0 | Jan. 1976 | 11.1 | Oct. 2000 | 2.6 |
| Michigan | 7.2 | Dec. 1982 | 16.8 | Mar. 2000 | 3.3 |
| Minnesota | 4.1 | Dec. 1982 | 9.1 | Mar. 1999 | 2.5 |
| Mississippi | 7.7 | Apr. 1983 | 13.5 | Apr. 2001 | 4.9 |
| Missouri | 6.3 | Feb. 1983 | 10.6 | Jan. 2000 | 2.8 |
| Montana | 4.6 | Mar. 1983 | 8.8 | Dec. 2006 | 3.1 |
| Nebraska | 3.6 | Feb. 1983 | 6.7 | Feb. 1998 | 2.2 |
| Nevada | 7.3 | Nov. 2010 | 13.9 | Apr. 2000 | 3.8 |
| New Hampshire | 4.3 | Sept. 1992 | 7.6 | May 1987 | 2.1 |
| New Jersey | 6.5 | Dec. 1976 | 10.7 | July 2000 | 3.6 |
| New Mexico | 6.6 | Mar. 1983 | 10.0 | June 2007 | 3.4 |
| New York | 6.2 | Nov. 1976 | 10.3 | Apr. 1988 | 4.0 |
| North Carolina | 6.7 | Feb. 2010 | 11.3 | Mar. 1999 | 3.1 |
| North Dakota | 2.8 | Feb. 1983 | 6.8 | Apr. 2014 | 2.5 |
| Ohio | 5.6 | Jan. 1983 | 13.9 | Jan. 2001 | 3.8 |
| Oklahoma | 4.7 | June 1983 | 9.2 | Dec. 2000 | 2.8 |
| Oregon | 7.1 | Jan. 1983 | 12.1 | Feb. 1995 | 4.7 |
| Pennsylvania | 5.7 | Mar. 1983 | 12.9 | Mar. 2000 | 4.0 |
| Rhode Island | 7.6 | Mar. 2010 | 11.9 | July 1988 | 2.9 |
| South Carolina | 6.6 | Dec. 2009 | 11.9 | Mar. 1998 | 3.2 |
| South Dakota | 3.4 | Feb. 1983 | 6.0 | Mar. 2000 | 2.5 |
| Tennessee | 7.3 | Jan. 1983 | 12.8 | May 2000 | 3.9 |
| Texas | 5.2 | Nov. 1986 | 9.3 | Jan. 2001 | 4.2 |
| Utah | 3.5 | Mar. 1983 | 10.0 | Mar. 2007 | 2.4 |
| Vermont | 4.4 | Jan. 1976 | 8.8 | Apr. 2000 | 2.4 |
| Virginia | 5.5 | Jan. 1983 | 7.8 | Dec. 2000 | 2.2 |
| Washington | 5.7 | Nov. 1982 | 12.2 | May 2007 | 4.4 |
| West Virginia | 6.6 | Mar. 1983 | 18.1 | Mar. 2008 | 3.9 |
| Wisconsin | 5.5 | Jan. 1983 | 11.5 | Feb. 2000 | 3.0 |
| Wyoming | 4.7 | Jan. 1987 | 9.1 | Apr. 1979 | 2.3 |
p = preliminary.
NOTE: Rates shown are a percentage of the labor force. Data refer to place of residence. Series begin in January 1976. Historical highs and lows show the most recent month that a rate was recorded in the event of multiple occurrences. Estimates for at least the latest five years are subject to revision early in the following calendar year.
Last Modified Date: October 21, 2014