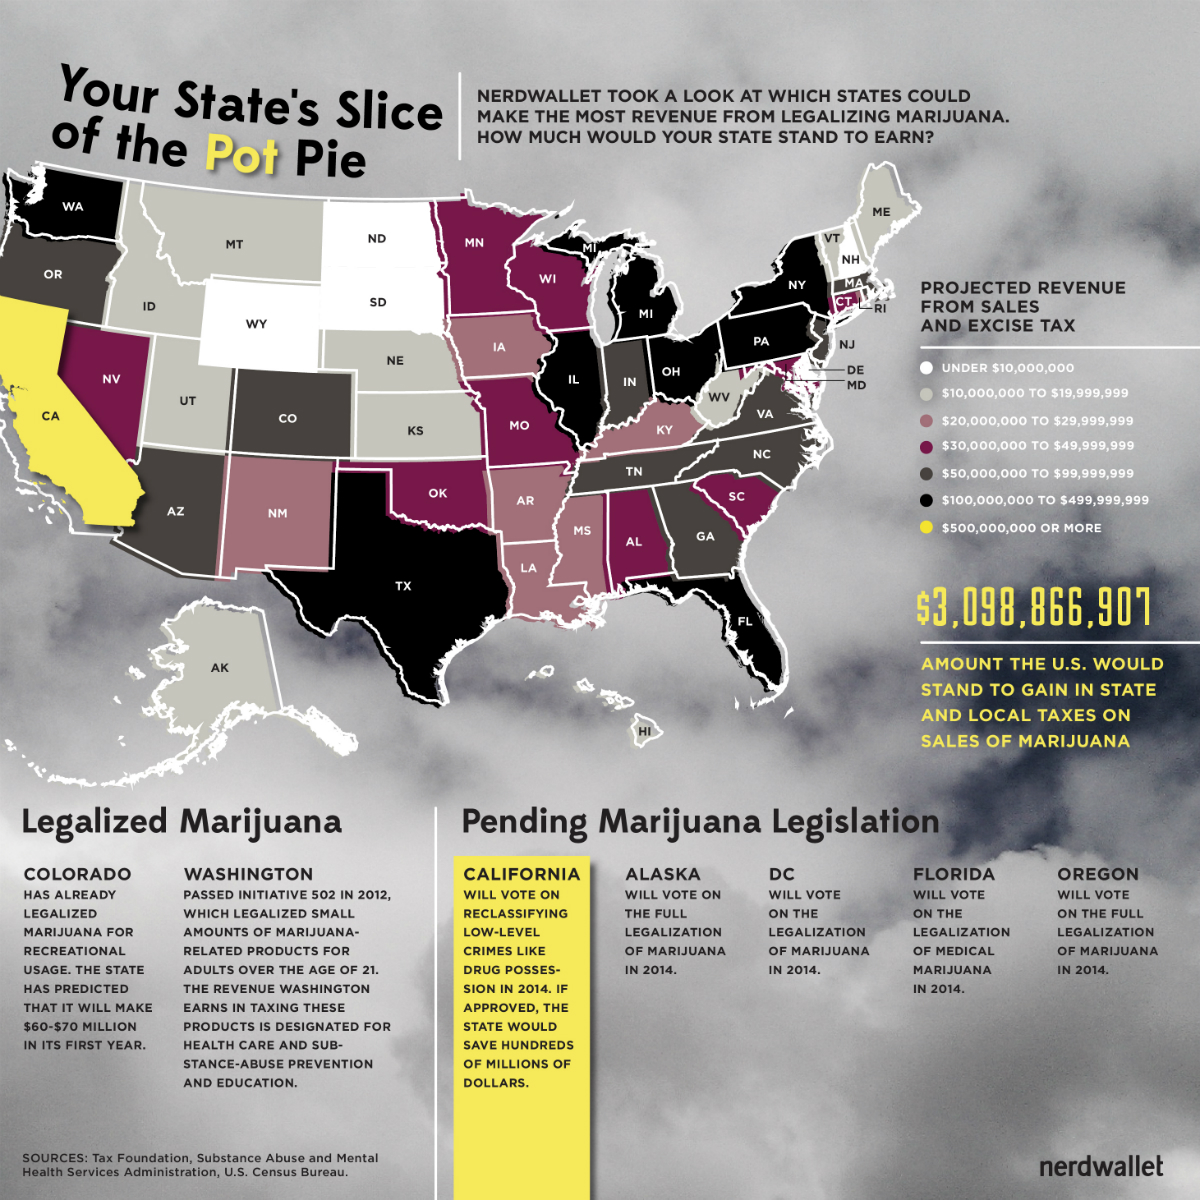
by Laura Krantz vtdigger.org and Vermont Business Magazine Vermont could gain as much as $11 million in tax revenue from legalized marijuana, according to an analysis performed by NerdWallet,a website that compares financial data for consumers. The nation as a whole could realize $3 billion in state and local taxes per year if it legalized pot, according to NerdWallet. The marijuana market in Vermont is worth approximately $54 million annually, NerdWallet estimated.

Creative Commons photo
The study is based on a formula that multiplies the number of pot smokers per state times the state and local sales tax, plus an excise tax states could impose on the drug, if it were legalized. SEE TABLE BELOW
Colorado and Washington are the only states to have legalized marijuana for recreational use, although in Vermont, 22 other states and the District of Columbia it is legal for specified medical purposes. Vermont has also decriminalized possession of small amounts of pot.
A bill to legalize marijuana in Vermont could come before the Legislature in January. Sen. David Zuckerman, P/D-Chittenden, introduced a legalization bill last session and has indicated that he will do so again in 2015.
A bill was passed last session to authorize a study, due in January, about potential revenue from legalizing, and taxing, marijuana.
Rand Corp., a nonpartisan, nonprofit research firm, is performing that study, which will also look at potential effects on public health and safety, as well as costs associated with legalization.
The Rand study will cost $120,000, a combination of $20,000 in taxpayer dollars and $100,000 from the philanthropic organization Good Ventures.
NerdWallet analyst Divya Raghavan performed the research for NerdWallet. Her analysis is based on two key figures: the worth of the underground marijuana industry nationwide and the number of pot smokers per state.
Because marijuana is bought and sold illegally in most states, it is difficult to estimate the industry’s worth. NerdWallet used research by Harvard University economist Jeffrey Miron, who pegged the national marijuana industry at $14 billion a year.
NerdWallet then used data from the federal government about the number of people age 26 or older who smoked marijuana in the past month (based on studies from 2011 and 2012,) to calculate the percentage of the nationwide market that each state represents.
Vermont constitutes 0.39 percent of the national marijuana market, according to NerdWallet. California makes up the largest share, 16 percent, and North Dakota represents the smallest, 0.13 percent.
NerdWallet then multiplied each state’s market share times the combined state and local sales tax rates and added a 15 percent excise tax, as Colorado has done.
The study estimated Colorado, which legalized sales in January, would collect $78 million annually in marijuana tax revenue.
A 2012 study pegged total revenue and savings in Colorado prior to 2017 at $60 million.
Colorado’s legislative attorneys this month estimated revenue will be $47.7 million, based on the first seven months of tax collections.
Colorado had collected about $30 million through June.
Vermont has the fourth-highest percentage of people 26 years or older who report having smoked pot in the past month, behind Alaska, Oregon and Rhode Island, according to the analysis.
Secretary of Administration Jeb Spaulding Monday pointed out that even if the state legalizes marijuana next year, it would not realize tax revenue the same year.
Spaulding also cautioned against viewing legalized marijuana as simply a moneymaker.
“It’s not just a question of how much you get in taxes, it’s also what it’s going to cost to run such a system,” he said.
Spaulding said he is waiting for the results of the Rand study to form an opinion on how legalization would affect Vermont.
How NerdWallet sizedthe marijuana market in each state:
Marijuana use is illegal in most states, so it’s difficult to get concrete numbers on the amount of marijuana purchased and consumed. To estimate this value, NW used data from the Substance Abuse and Mental Health Services Administration detailing the percentage of marijuana smokers ages 25 and over in each state and multiplied that percentage by the state’s population older than 25 to get the number of users in each state. It then took the state’s users as a percentage of total users over 25 in the U.S. and multiplied that by the total marijuana market estimate (sized at$14 billionbyHarvard University economist Jeffrey Miron) to determine the market sizein each state.
How NerdWallet calculated state sales tax revenue:
NW used state and local tax rates compiled by the nonpartisan Tax Foundation to estimate the amount each state would earn in sales tax revenue. It added in a 15% excise tax (a tax levied on a specific good, such as cigarettes or gas), which is the excise tax in Colorado for marijuana purchases. NerdWallet’s estimates are conservative. This analysis doesn’t account for several factors, including:
- Variations in excise taxes: Each state will determine its own taxes, but for our calculations, we assumed the same 15% excise tax that Colorado collects across all states.
- Reduced spending on law enforcement: We didn’t include the money states would save by not having to enforce laws against the use of marijuana. Miron, the Harvard economist, estimates a savings of $7.7 billion annually nationwide on law enforcement.
- Medical marijuana sales: We didn’t deduct the amount of revenue raised in states that have legalized medical marijuana. The total revenue we calculated for California, for example, includes revenue they already make from medical marijuana sales.
- Potential market changes: If marijuana becomes legal for wider recreational use, consumption could increase, which would make our current market estimates low.
How much hasColorado made since legalizing marijuana? In the first six months of this year, the state collected $25,307,067 in taxes on the sales of marijuana. By June 2015, Colorado expects to collect up to $70 million—not very far off from our estimate of $78,157,904. Take a look at the chart to see how much each state could collect per year in sales taxes if the recreational and medical use of marijuana was made legal.
| State | Population age 25 and older | Population over 25 who has smoked marijuana in the past month | Number of marijuana smokers | State’s percentage of US marijuana market | Marijuana market size | Combined sales tax rate (state and local) | Excise tax rate | Revenue from sales and excise tax |
|---|---|---|---|---|---|---|---|---|
| Alabama | 3,209,646 | 3.38% | 108,486 | 1.03% | $144,086,238 | 8.51% | 15% | $33,874,675 |
| Alaska | 464,594 | 11.18% | 51,942 | 0.49% | $68,986,493 | 1.69% | 15% | $11,513,846 |
| Arizona | 4,280,464 | 5.33% | 228,149 | 2.16% | $303,016,813 | 8.17% | 15% | $70,208,995 |
| Arkansas | 1,949,382 | 3.61% | 70,373 | 0.67% | $93,465,820 | 9.19% | 15% | $22,609,382 |
| California | 24,779,784 | 6.74% | 1,670,157 | 15.84% | $2,218,227,477 | 8.41% | 15% | $519,287,052 |
| Colorado | 3,444,654 | 7.63% | 262,827 | 2.49% | $349,075,052 | 7.39% | 15% | $78,157,904 |
| Connecticut | 2,457,978 | 6.01% | 147,724 | 1.40% | $196,200,961 | 6.35% | 15% | $41,888,905 |
| Delaware | 618,612 | 4.95% | 30,621 | 0.29% | $40,669,816 | 0.00% | 15% | $6,100,472 |
| District of Columbia | 439,531 | 7.24% | 31,822 | 0.30% | $42,264,598 | 5.75% | 15% | $8,769,904 |
| Florida | 13,503,747 | 4.73% | 638,727 | 6.06% | $848,328,585 | 6.62% | 15% | $183,408,640 |
| Georgia | 6,403,838 | 3.88% | 248,469 | 2.36% | $330,005,160 | 6.97% | 15% | $72,502,134 |
| Hawaii | 952,281 | 5.69% | 54,185 | 0.51% | $71,965,783 | 4.35% | 15% | $13,925,379 |
| Idaho | 1,012,786 | 3.77% | 38,182 | 0.36% | $50,711,646 | 6.03% | 15% | $10,664,659 |
| Illinois | 8,558,895 | 4.79% | 409,971 | 3.89% | $544,505,009 | 8.16% | 15% | $126,107,360 |
| Indiana | 4,278,945 | 4.31% | 184,423 | 1.75% | $244,941,652 | 7.00% | 15% | $53,887,163 |
| Iowa | 2,036,993 | 4.13% | 84,128 | 0.80% | $111,734,749 | 6.78% | 15% | $24,335,828 |
| Kansas | 1,863,224 | 2.55% | 47,512 | 0.45% | $63,103,568 | 8.15% | 15% | $14,608,476 |
| Kentucky | 2,935,461 | 3.65% | 107,144 | 1.02% | $142,304,242 | 6.00% | 15% | $29,883,891 |
| Louisiana | 3,006,605 | 3.02% | 90,799 | 0.86% | $120,595,745 | 8.89% | 15% | $28,810,324 |
| Maine | 947,017 | 6.29% | 59,567 | 0.57% | $79,114,682 | 5.50% | 15% | $16,218,510 |
| Maryland | 3,972,135 | 3.66% | 145,380 | 1.38% | $193,087,319 | 6.00% | 15% | $40,548,337 |
| Massachusetts | 4,556,609 | 6.34% | 288,889 | 2.74% | $383,689,301 | 6.25% | 15% | $81,533,976 |
| Michigan | 6,621,018 | 6.61% | 437,649 | 4.15% | $581,265,967 | 6.00% | 15% | $122,065,853 |
| Minnesota | 3,600,744 | 4.33% | 155,912 | 1.48% | $207,075,543 | 7.19% | 15% | $45,950,063 |
| Mississippi | 1,911,968 | 3.88% | 74,184 | 0.70% | $98,528,305 | 7.00% | 15% | $21,676,227 |
| Missouri | 4,023,641 | 3.83% | 154,105 | 1.46% | $204,675,880 | 7.58% | 15% | $46,215,814 |
| Montana | 686,770 | 7.94% | 54,530 | 0.52% | $72,423,663 | 0.00% | 15% | $10,863,549 |
| Nebraska | 1,206,908 | 3.74% | 45,138 | 0.43% | $59,950,724 | 6.79% | 15% | $13,063,263 |
| Nevada | 1,840,642 | 6.44% | 118,537 | 1.12% | $157,435,933 | 7.93% | 15% | $36,100,059 |
| New Hampshire | 919,883 | 5.41% | 49,766 | 0.47% | $66,096,510 | 0.00% | 15% | $9,914,476 |
| New Jersey | 6,049,352 | 3.96% | 239,554 | 2.27% | $318,165,225 | 6.97% | 15% | $69,900,900 |
| New Mexico | 1,360,330 | 6.94% | 94,407 | 0.90% | $125,386,972 | 7.26% | 15% | $27,911,140 |
| New York | 13,309,761 | 5.98% | 795,924 | 7.55% | $1,057,109,824 | 8.47% | 15% | $248,103,676 |
| North Carolina | 6,489,883 | 4.24% | 275,171 | 2.61% | $365,469,713 | 6.90% | 15% | $80,037,867 |
| North Dakota | 457,904 | 3.07% | 14,058 | 0.13% | $18,670,738 | 6.55% | 15% | $4,023,544 |
| Ohio | 7,770,716 | 5.39% | 418,842 | 3.97% | $556,286,435 | 7.11% | 15% | $122,994,931 |
| Oklahoma | 2,487,456 | 4.55% | 113,179 | 1.07% | $150,319,552 | 8.72% | 15% | $35,655,798 |
| Oregon | 2,671,772 | 10.25% | 273,857 | 2.60% | $363,723,974 | 0.00% | 15% | $54,558,596 |
| Pennsylvania | 8,756,317 | 4.20% | 367,765 | 3.49% | $488,449,235 | 6.34% | 15% | $104,235,067 |
| Rhode Island | 712,271 | 9.74% | 69,375 | 0.66% | $92,140,993 | 7.00% | 15% | $20,271,018 |
| South Carolina | 3,151,616 | 5.15% | 162,308 | 1.54% | $215,570,433 | 7.19% | 15% | $47,835,079 |
| South Dakota | 544,292 | 4.28% | 23,296 | 0.22% | $30,940,291 | 5.83% | 15% | $6,444,863 |
| Tennessee | 4,336,473 | 3.81% | 165,220 | 1.57% | $219,437,219 | 9.45% | 15% | $53,652,400 |
| Texas | 16,390,379 | 3.30% | 540,883 | 5.13% | $718,375,651 | 8.15% | 15% | $166,303,963 |
| Utah | 1,641,335 | 3.04% | 49,897 | 0.47% | $66,270,383 | 6.68% | 15% | $14,367,419 |
| Vermont | 434,948 | 9.34% | 40,624 | 0.39% | $53,955,147 | 6.14% | 15% | $11,406,118 |
| Virginia | 5,504,766 | 3.44% | 189,364 | 1.80% | $251,504,623 | 5.63% | 15% | $51,885,404 |
| Washington | 4,645,859 | 8.11% | 376,779 | 3.57% | $500,421,024 | 8.88% | 15% | $119,500,540 |
| West Virginia | 1,296,201 | 3.29% | 42,645 | 0.40% | $56,639,175 | 6.07% | 15% | $11,933,874 |
| Wisconsin | 3,854,170 | 4.65% | 179,219 | 1.70% | $238,030,433 | 5.43% | 15% | $48,629,618 |
| Wyoming | 380,942 | 4.36% | 16,609 | 0.16% | $22,059,416 | 5.49% | 15% | $4,519,974 |
| Total U.S. | 208,731,498 | 5.05% | 10,540,941 | N/A | $14,000,000,000 | N/A | N/A | $3,098,866,907 |