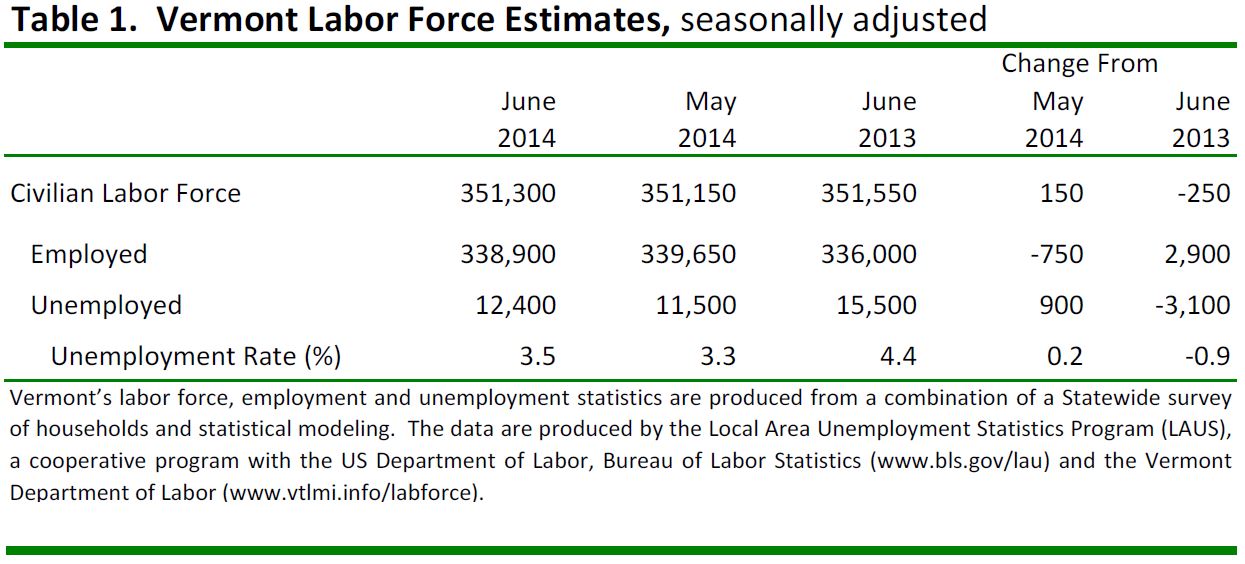
Vermont Business Magazine All the key metrics were negative last month as the Vermont Department of Labor announced today that the seasonally-adjusted statewide unemployment rate for June 2014 was 3.5 percent. This represents an increase of two-tenths of a percent from the previously reported May rate (3.3 percent). The equivalent national average was 6.1 percent, which decreased by two-tenths of a percent from the previous month’s estimate. The seasonally adjusted Vermont data for June show the Vermont civilian labor force increased by 150 from the prior month estimates. The number of employed decreased by 750 and the number of unemployed increased by 900. However, the number of employed is up 2,900 from a year ago. While an increase in the labor force is generally good news for the economy, it acts as the denominator for the purposes of the unemployment rate, therefore as the labor force increases it can drive the rate up if the number of unemployed does not fall. In this case, while the labor force increased only slightly, the number of unemployed increased disproportionally, thus increasing the overall unemployment rate. The over-the-month changes to the number of unemployed and the unemployment rate were statistically significant in the seasonally-adjusted series.
This is the first monthly increase to the statewide unemployment rate in Vermont in ten months. Vermont’s unemployment rate is tied for second lowest in the nation with Nebraska and Utah and behind only North Dakota at 2.7 percent (See National Review Below).
“The June data saw a rise in the state unemployment rate. The initial modeling has been relatively consistent with what we have seen in the past few years - with the summer months experiencing temporary spikes up. If historical patterns hold, this temporary period of adjustment should be present for the next month or two before returning to the recent downward trend. Our department will closely monitor the data for any concerning issues or trends. The Vermont Department of Labor staff are working closely with Vermont employers to connect job seekers to current openings, and to support all unemployed Vermonters with training and job-readiness programs. Our regional offices welcome all Vermonters to the offices for whatever job assistance they need”, said Commissioner Annie Noonan.
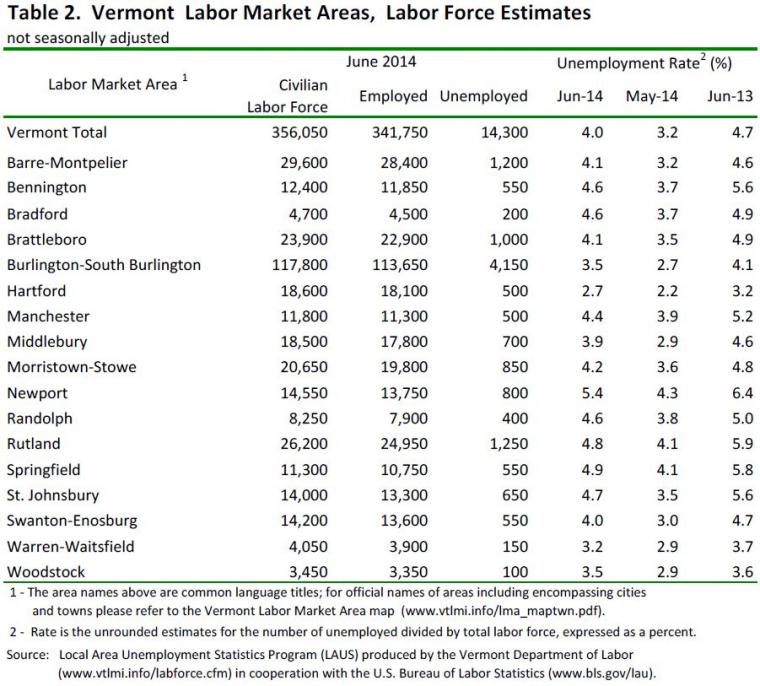
June unemployment rates for Vermont’s 17 labor market areas (See Table Below) ranged from 2.7 percent in Hartford to 5.4 percent in Newport (note: local labor market area unemployment rates are not seasonally adjusted). For comparison, the June unadjusted unemployment rate for Vermont was 4.0 percent which reflects an increase of eight-tenths of a percent from the May level and a decline of seven-tenths of a percent from a year ago. Vermont has the fifth lowest unadjusted rate, with North Dakota lowest at 3.0 percent
Not Seasonally Adjusted
The preliminary ‘not-seasonally-adjusted’ jobs estimates for June show an increase of 2,500 jobs when compared to the revised May numbers. This reported over-the-month change does not include the 200 job decrease between the preliminary and the revised May estimates due to the inclusion of more data. The monthly increase seen in the June numbers was attributable to seasonal increases related to Construction and Leisure & Hospitality industries. The broader economic trends can be detected by focusing on the over-the-year changes in this data series. As detailed in the preliminary ‘not-seasonally-adjusted’ June data, Total Private industries have increased by 0.3 percent (800 jobs) and Government employment has decreased by 0.4 percent (200 jobs). Seasonally Adjusted The seasonally adjusted data for June reports a decrease of 1,600 jobs from the revised May data. As with the ‘not-seasonally-adjusted’ data, this over-the-month change is from the revised May numbers which experienced a 200 job decrease from the preliminary estimates. The seasonally adjusted over-the-month changes in June were mixed at the sectorial level. Those with a notable percent increase include: Professional and Business Services (+300 jobs or +1.1 percent), Education & Health Services (+600 jobs or +1.0 percent) and Construction (+100 jobs or +0.7 percent). Industries with a notable percent decrease include: Leisure & Hospitality (-1,100 jobs or -3.1 percent), State Government (-400 jobs or -2.2 percent) and Trade, Transportation & Utilities (-800 jobs or -1.4 percent).
REGIONAL AND STATE EMPLOYMENT AND UNEMPLOYMENT -- JUNE 2014 (See Table Below)
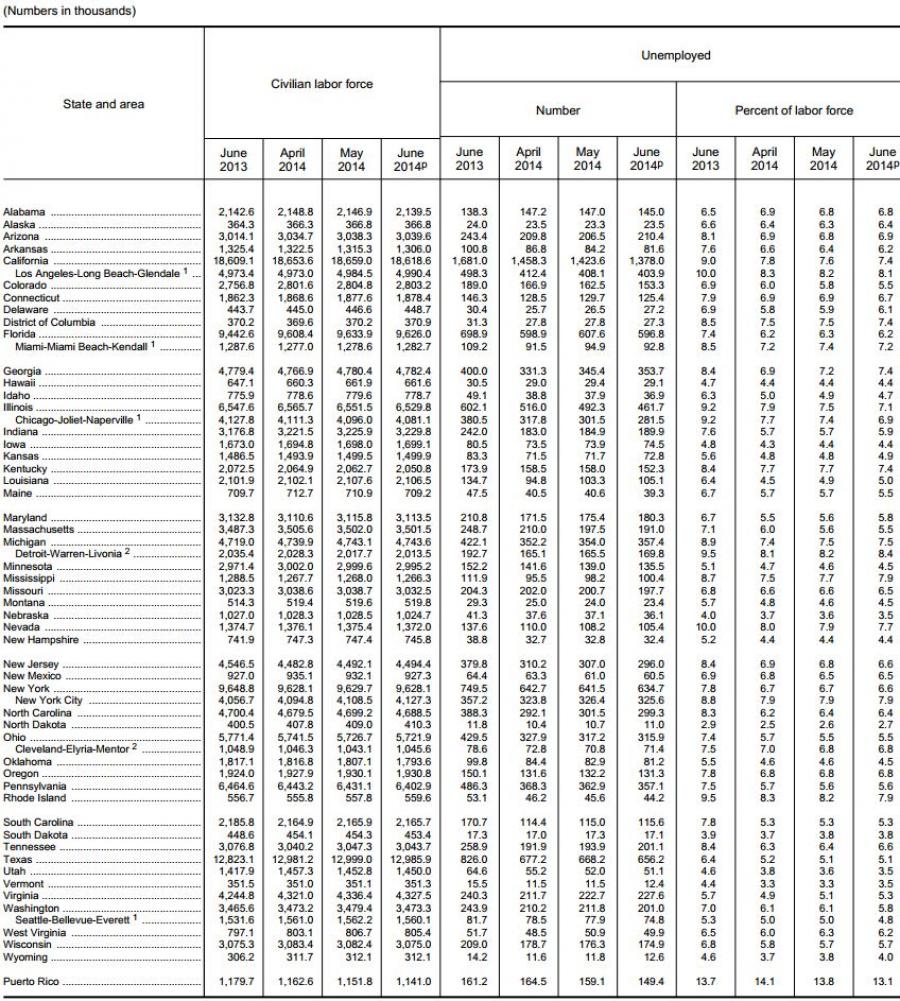
Regional and state unemployment rates were generally little changed in June. Twenty-two states and the District of Columbia had unemployment rate decreases from May, 14 states had increases, and 14 states had no change, the U.S. Bureau of Labor Statistics reported today. Forty-nine states and the District of Columbia had unemployment rate decreases from a year earlier and one state had an increase. The national jobless rate declined to 6.1 percent from May and was 1.4 percentage points lower than in June 2013. In June 2014, nonfarm payroll employment increased in 33 states and the District of Columbia and decreased in 17 states. The largest over-the-month increases in employment occurred in Florida (+37,400), California (+24,200), and New York (+22,500). The largest over-the-month decrease in employment occurred in Georgia (-9,500), followed by West Virginia (-9,100) and Alaska (-5,900). The largest over-the-month percentage increases in employment occurred in the District of Columbia, Indiana, North Dakota, and Oklahoma (+0.6 percent each). The largest over-the-month percentage decline in employment occurred in Alaska (-1.7 percent), followed by West Virginia (-1.2 percent), and New Hampshire and New Mexico (-0.6 percent each). Over the year, nonfarm employment increased in 47 states and the District of Columbia and decreased in 3 states. The largest over-the-year percentage increase occurred in North Dakota (+4.8 percent), followed by Nevada (+3.9 percent) and Utah (+3.5 percent). The over-the-year percentage decreases in employment occurred in Alaska (-0.7 percent), Vermont (-0.1 percent), and New Mexico (which declined by less than 0.05 percent).
Regional Unemployment (Seasonally Adjusted)
In June, the West continued to have the highest regional unemployment rate, 6.7 percent, while the Midwest had the lowest rate, 5.9 percent. The West and Northeast had statistically significant over-the-month unemployment rate changes (-0.2 percentage point and -0.1 point, respectively). Significant over-the-year rate decreases occurred in all four regions: the Northeast (-1.5 percentage points), Midwest and West (-1.4 points each), and South (-1.2 points). (See table 1.) Among the nine geographic divisions, the East South Central and Pacific had the highest jobless rates, 7.0 percent each in June. The West North Central again had the lowest rate, 4.9 percent. Over the month, the Pacific and New England had statistically significant unemployment rate changes (-0.3 percentage point and -0.2 point, respectively). All nine divisions had significant rate declines from a year earlier, the largest of which occurred in the East North Central (-1.8 percentage points) and Middle Atlantic and Pacific (-1.5 points each).
State Unemployment (Seasonally Adjusted)
Mississippi and Rhode Island had the highest unemployment rates among the states in June, 7.9 percent each. North Dakota again had the lowest jobless rate, 2.7 percent. In total, 17 states had unemployment rates significantly lower than the US figure of 6.1 percent, 8 states and the District of Columbia had measurably higher rates, and 25 states had rates that were not appreciably different from that of the nation. (See tables A and 3.) In June, six states had statistically significant over-the-month unemployment rate declines: Illinois (-0.4 percentage point); Colorado, Rhode Island, and Washington (-0.3 point each); and California and New Jersey (-0.2 point each). Vermont had the only significant over-the-month rate increase (+0.2 percentage point). The remaining 43 states and the District of Columbia had jobless rates that were not measurably different from those of a month earlier, though some had changes that were at least as large numerically as the significant changes. Thirty-four states and the District of Columbia had statistically significant jobless rate changes over the year, all of which were decreases. The largest of these occurred in South Carolina (-2.5 percentage points), Nevada (-2.3 points), and Illinois (-2.1 points). The remaining 16 states had rates that were not appreciably different from those of a year earlier.
Nonfarm Payroll Employment (Seasonally Adjusted)
In June 2014, 15 states had statistically significant over-the-month changes in employment, 11 of which were increases. The largest statistically significant job gains occurred in Florida (+37,400), California (+24,200), and New York (+22,500). The four statistically significant job decreases occurred in West Virginia (-9,100), Alaska (-5,900), New Mexico (-4,700), and New Hampshire (-3,900). (See tables C and 5.) Over the year, 30 states had statistically significant changes in employment, all of which were positive. The largest over-the-year job increase occurred in Texas (+371,000), followed by California (+356,400) and Florida (+237,500).
1 Metropolitan division. 2 Metropolitan statistical area. p = preliminary.
NOTE: Data refer to place of residence. Data for Puerto Rico are derived from a monthly household survey similar to the Current Population Survey.
Area definitions are based on Office of Management and Budget Bulletin No. 10-02, dated December 1, 2009, and are available on the BLS website at www.bls.gov/lau/lausmsa.htm.
Estimates for the latest month are subject to revision the following month.