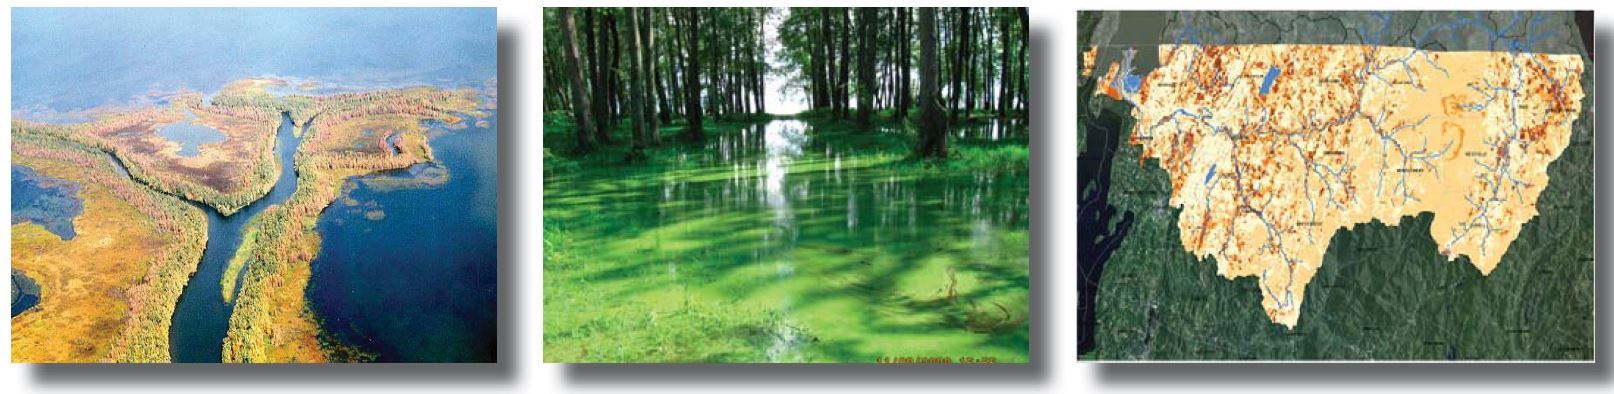
Vermont Business Magazine Friday, July 18, the Vermont Department of Agriculture will hold a public hearing regarding a petition to require "Best Management Practices" for select farms in the Missisquoi Bay Basin. Missisquoi Bay is an ecologically rich region of the lake that includes Lake Champlain's largest river delta and the Missisquoi National Wildlife Refuge (designated as a wetland of international importance). On many summer days it's a great place to paddle, catch fish, or cool off with a swim. But the bay is also plagued by blue-green algae blooms that inhibit use, threaten public health and have reverberating economic effects. These blooms are fed in part by nutrient loading. Agriculture contributes significantly to the region's cultural heritage and economy but it is also the major source of nutrient loading to the bay, according to the Lake Champlain Committee. The hearing will start at 9:30 at the St Albans Historical Society on Church Street in St Albans.
 The petition seeks to better protect the bay from pollution from poorly managed agricultural operations by requiring "Best Management Practices" from select farms. It is based on a scientific study (CLICK ON IMAGE TO GET REPORT. THIS IS A VERY LARGE PDF WHICH COULD BE SLOW TO LOAD. SEE EXECUTIVE SUMMARY BELOW) that identified "critical source areas" of phosphorus discharge. These are areas that send a disproportionately large amount of phosphorus to the lake because of the soils, slopes or types of farming done. Practices that would be required of farms with critical source areas include:
Cover crops that are planted in the field after the primary crop is harvested. They help retain soil, improve soil health, suppress weeds, and hold nutrients in place to feed future crops rather than flowing into ground or surface water.
Grassed waterways to direct runoff from terraces, diversions and other concentrated flow areas. They help control erosion and protect water quality by filtering sediments and nutrients.
Vegetative filter strips of close growing plants such as grasses that are planted around fields, drainage areas and waterways. They reduce the amount of sediment, organic material, chemicals and nutrients in runoff by slowing the waterflow and allowing contaminants to settle out.
While many farmers have implemented practices to reduce pollution and soil erosion we can't depend on voluntary actions, especially in areas like Missisquoi Bay where water quality is already compromised. Attend the hearing and add your voice to the call for greater regulatory controls to prevent pollution, protect lake health and the economy that relies on clean, accessible water. If you can't participate in the hearing you can file written comments up until 4:30 PM on August 18. Written comments should be directed to:
Laura DiPietro, Vermont Agency of Agriculture, 116 State Street, Montpelier, VT 05620 or [email protected].
REPORT EXECUTIVE SUMMARY
The Missisquoi Bay Basin (MBB) straddles the Vermont-Québec border, and is dominated by forests (67%)
and agricultural lands (17%). Urban and other built-up uses comprise less than 5% of the land cover in the
watershed. Due to the extensive nature of agricultural land use in the watershed, an estimated 64% of the total
upland phosphorus (P) load delivered by the MBB annually is attributable to agricultural sources.
Public concern over water quality in Missisquoi Bay remains high. Missisquoi Bay shows some of the most
profound effects of P pollution, with recurrent blue-green algae blooms that are both unsightly and potentially
toxic. Since 2002, Vermont has invested approximately $10 million annually, in combined state and federal
resources, in programs designed to improve water quality in Lake Champlain. These efforts are subject to
intense scrutiny, in part because to date they have failed to yield the desired improvements in Lake Champlain
water quality. Further, in this era of shrinking government resources it is unlikely that increased annual
funding will be provided to this effort. Tools are needed that can help program managers identify priorities for
implementation and better target their efforts to those areas of the landscape that disproportionately contribute
P pollution, often termed critical sources areas (CSAs).
The overall purpose of this project was to identify CSAs in order to improve the cost-effectiveness and
efficiency of land treatment efforts to reduce P loads. This report presents the results of intensive watershed
modeling of the MBB to identify critical source areas of phosphorus pollution at both a strategic and a tactical
scale.
The strategic level assessment of critical source areas employed a Soil and Water Assessment Tool (SWAT)
model that was capable of assessing broad watershed-scale trends, while also able to evaluate land use
categories, sub-watershed characteristics, and field-level assessments of P source areas. In all cases, the SWAT
model was applied over the entire watershed. The tactical level work combined data generated through the
strategic assessment with other high-resolution datasets to define CSAs at a scale practical for specifying Best
Management Practices (BMPs) at the farm and field scale.
Project Objectives
The principal goal of this project is to identify, locate, and rank the most important critical source areas of
phosphorus loads in the Vermont sector of the Missisquoi Bay Basin. Key project objectives include:
- Identification and ranking of CSAs in the MBB at the watershed (i.e., strategic) scale using
available basin-wide data sources and a calibrated/validated watershed model;
- Evaluation of the P load reduction potential for alternative BMP strategies following a traditional
implementation approach versus implementation targeted to identified CSAs;
- Comparison of watershed model results with a simpler multivariate GIS-overlay technique that
might be more easily applied to other regions of the Lake Champlain Basin;
- Evaluation of potential changes to P loading in the MBB and CSA ranking potentially resulting
from climate change; and
Lake Champlain Basin Program / Identification of Critical Source Areas of Phosphorus Within the Vermont Sector of the Missisquoi Bay Basin / December 15, 2011 xvii
- Use of more precise, site-specific input data and better spatial resolution to improve
identification, ranking, and prioritization of CSAs at a farm-scale (i.e., tactical) level.
Key Findings
Strategic Analysis
The SWAT model was used to evaluate sediment and P contributions at several scales as part of the strategic
level analysis.
The watershed-scale SWAT simulations indicate that about 60% of the sediment and P loads from the
assessment area (Vermont portion of the MBB) come from upland sources, whereas about 40% are attributable
to erosion of streambanks. These values are within the same range of the 29% - 42% sediment contribution
and ~50% total P contribution from bank sources suggested by a separate project (BSTEM modeling) recently
conducted within the Missisquoi River watershed.
Some of the key findings, with respect to upland sources by land use type, are:
- Land in corn-hay rotation produced the greatest contribution (29%) of the total MBB P load from
upland sources;
- Forest has the lowest total P areal loading rate at 0.14 kg/ha/yr, but because it is the predominant
land use in the basin, is the second highest total contributor at 20% of the total;
- For cultivated cropland (soybean-corn, corn-hay, and permanent corn), the vast majority of total
P load is in the form of sediment P (85 to 90%);
- For agricultural grassland (permanent hay and pasture), the majority of the total P load is in the
form of soluble P (66% to 72%);
- The developed land use classes (medium and low density residential, dirt and paved roads) fall in
the middle among the different land uses in terms of average P loading rates; however, because
these areas comprise only a small fraction of the total area assessed (3.5%), their overall impact
of total P load in the watershed is quite small; and
- Total P contribution as a percent of the total MBB load from upland sources can be summarized as follows for broad land uses classes:
o Agricultural: 64%
o Developed: 6%
o Undeveloped: 30%
The SWAT model allowed identification of critical MBB subwatersheds based on P loading rate. Within the
MBB, those watersheds with the highest fractions of agricultural land, such as the Rock, Mud, Pike, and
Hungerford, have the higher total P loading rates, ranging from 0.55 – 0.81 kg P/ha/yr (subwatershed average).
The modeling effort also calculated estimated sediment and P loading rate from HUC-12 sub-watersheds and
from some 103,666 individual Hydrologic Response Unites (HRUs). Phosphorus loading rates have been
mapped at each of these scales; maps are presented in the full report.
Three factors—hydrologic soil group, compound topographic index (CTI), and slope—were shown to be the
most important factors driving the magnitude of P export and the incidence of CSAs. The CTI class was found
to have the greatest influence on soluble P losses, while slope was most influential on particulate P export.
Hydrologic soil group was highly influential for total P export, including both particulate and soluble forms of
P. It should be noted, however, that interaction among different landscape and soils characteristics makes
identification of one or two factors as direct predictors of the magnitude of total P export difficult. This
complexity of interactions is what makes the SWAT model well suited to sorting out the subtleties in different
characteristics that influence P export. This is accomplished through the independent parameterization of
HRUs based on localized variability in soils, topographic, climate, and agronomic conditions. The HRU-level
identification of P CSAs is presented and discussed in later sections of this report. CSAs identified at multiple
scales are mapped in detail in the full report.
See Section 3.1 for additional detail on the strategic-level analysis
Traditional vs. Targeted BMP Implementation
To evaluate potential P load reduction when BMP strategies are targeted to priority problem areas (i.e., CSAs)
as compared to implementation in a traditional manner (i.e., essentially random, based primarily on landowner
voluntary participation), the model was used to test three BMPs. These were: manure P reduction, cover
cropping, and changes in crop rotations. For each BMP tested, significant benefit resulted from implementing
the BMP on a targeted area representing the eligible land in the highest CSA category. Phosphorus load
reductions from targeted implementation were two to three times those achieved by random implementation
for all three of the tested practices.
See Section 3.5 for a more detailed explanation.
Utility of GIS-based Techniques
The results of the GIS-based CSA analysis were generally as expected, and compare moderately well with the
SWAT model assessment. Visually, the GIS-based results appear to be heavily influenced by land use classes.
In general, agricultural, farmstead, and developed areas had higher risk values compared with areas of natural
vegetation, such as forests and wetlands. Risk predicted by the GIS-based analysis increased as distance to
stream decreased. The effect of the soil was less apparent in the GIS-based analysis then it was with the SWAT
model, but in general, areas with clayey or silty soils tended to have higher risk than areas with sandy soil.
Similarly, high slope seemed to have less influence over the result in the GIS-based approach than in SWAT;
however, most areas with high slopes are forested and these areas are assumed to have extremely low risk
under the GIS-based approach. The GIS-based method’s prediction of wetlands as less significant potential
CSAs compared to the SWAT model assessment results from the GIS method’s lack of consideration of the
phosphorus geochemical cycling simulated by SWAT.
See Section 3.4 for additional detail.
Climate Change Scenarios
Two different climate change scenarios were evaluated using the MBB SWAT model, for the period 2041-
2070. These scenarios represented the upper and lower bounds of projected changes in P loading, based on
recent work in the LaPlatte River watershed in central Vermont (Perkins 2011). The SWAT model predicted
an increase in the total sediment load of 21% and 57% over the baseline load for the lower and upper bound
climate scenarios, respectively. This load increase did not occur uniformly over the different land uses with the
study area. The farmstead and road land use classes saw the lowest increases in sediment; hay and pasture land
uses saw the largest increases in sediment load both showing greater than 100% increases under the upper
bound climate scenario. For total P, the load increased by 13% and 46% over the baseline for the lower and
upper bound climate scenarios, respectively.
Although the magnitudes of the change in P loading rates varied across the land use classes, the land uses that
ranked as highest P CSAs in the baseline scenario did not change under the future climate scenarios. The data
suggest that designing BMPs and P reduction strategies based on an analysis of current climate conditions
should target the same groups of P CSAs that will probably continue to be the most important under future
climate conditions.
See Section 3.6 for additional detail on the predicted effects of climate change on P loading in the MBB.
Tactical Analysis
The SWAT model was built so that agricultural field boundaries were directly incorporated into the model
structure. This strategy enabled the highly detailed field-level information to be developed as part of the
strategic analysis. This was carried forward in the tactical analysis by combining the field-level results with
additional information on the proximity of each field to the nearest receiving water.
Areas of intensive agriculture, such as the Rock, Hungerford, lower Black, and Mud sub-watersheds, still stand
out as having high concentrations of CSAs; however, hydrologic proximity is an important determining factor
in the total P load. This is most evident in considering undeveloped, higher elevation areas with shallow soils
on steeper slopes that move up higher in the rankings when consideration of hydrologic proximity is included.
See Sections 3.2 and 3.3 for further information on the tactical analysis.
Limitations to the Analysis
Statistician George Box is generally credited with saying: “All models are wrong, some models are useful.”
The SWAT model required that certain agronomic management operations such as tillage, planting, and
harvest dates, manure or fertilizer application rates, and crop rotations be specified for each unit of cropland,
even though such data did not exist for specific fields in the MBB. Nevertheless, SWAT parameters had to be
estimated. Thus, we developed reasonable descriptions of these agronomic operations, based on known
conditions in the MBB and applied them basin-wide, because we were reluctant to create a bias by arbitrarily
assuming different practices/conditions for different fields in the watershed. Although this approach may tend
to over-estimate the contribution of fields that have already implemented management measures, the long-term
simulation and uniform assumptions provide field-specific risk predictions that should hold great value for
program managers in targeting the use of certain BMP interventions. Further, the model clearly demonstrates
the value of implementing BMPs in the areas of highest risk.
Conclusions
The results of this project show that that some land uses within the watershed produce a disproportionately
high amount of P relative to the fraction of the total watershed area they represent. For example, while
agricultural land uses represent 17% of the total land area in the MBB, they contribute nearly 65% of the total
P load. Similarly, developed land uses (residential areas and roads) that account for less than 3% of the
watershed area contribute approximately 6% of the total P load.
The MBB SWAT model was able to evaluate the P load associated with specific landscape units, from major
sub-watersheds, through smaller subbasins, down to the highest resolution landscape representation—the
unique combinations of land use, soils, and topographic characteristics that form a SWAT HRU. These areas
have been mapped and described quantitatively. Identifying CSAs at multiple scales allows future
management activities to be focused on major sub-watershed, subbasin, and field scale goals.
The model also clearly demonstrated the value of targeting BMPs to the areas of highest risk. For each BMP
tested, significant benefit was realized by implementing the BMP on areas representing the most important
CSAs. For the three BMP scenarios tested, targeted BMPs gave two to three times the P load reduction that
resulted from traditional, more random, implementation.
As would be expected, model results also demonstrated that the proximity of a particular CSA to a surface
water feature is quite important in estimating its relative impact. Specifically, giving consideration to surface
water proximity allowed for important distinctions within an otherwise uniform ranking class that was largely
driven by land use and soils.
A separate modeling analysis was also performed for a single farm operation in the MBB. This model was
designed to identify CSAs at the level necessary to determine individual management measures that could be
expected to have the greatest success in reducing P loads. In addition, the farmer was interested in using the
farm-specific model to quantify the benefits of practices he has already installed. The ability to produce
meaningful results at this scale was heavily influenced by the agronomic records the farmer made available for
the project. Without detailed, farm-specific data the value of this modeling analysis would have been greatly
reduced.
The methods used to identify CSAs in the MBB should have value to other efforts in other regions of the
Champlain Basin. That said, the MBB represents a unique set of land use, soil, slope, and receiving water
conditions and the modeling analysis relied on a suite of data (e.g., LiDAR, CLU boundaries) that is not
currently available basin-wide. It would therefore be imprudent to simply extend the SWAT MBB model
results directly to the rest of the Champlain Basin. Nevertheless, there are several key observations from this
effort that should have broad application.
These include:
- There is enormous value to long-term simulation. Wet weather events drive the annual P loads
delivered to Missisquoi Bay, and are subject to a significant amount of year-to-year variability;
coupled with ongoing crop rotations, it is virtually guaranteed that no two years will look the
same. The value of a long-term simulation is that it can smooth the variability, and identify
particular land units will contribute the greatest pollution load over the long term.
- The model also demonstrates the value of targeting BMPs to the areas of highest risk. For each
BMP tested, significant benefit was realized by implementing the BMP in the areas identified as
Lake Champlain Basin Program / Identification of Critical Source Areas of Phosphorus Within the Vermont Sector of the Missisquoi Bay Basin / December 15, 2011 xxi
having the highest P loading rates in the baseline scenario. From both an environmental quality
and an economic perspective, choosing a targeted BMP implementation strategy offers clear
benefits.
- Although it can be tempting to use all available data, it is important to avoid introducing bias into
the model by relying on incomplete datasets. For example, farmers who have invested heavily in
conservation practices are understandably interested in having these investments reflected in the
model. The challenge, however, is that complete, spatially-referenced datasets of all of the
conservation practices that have been implemented in the MBB are simply not available. To
incorporate data on a case-by-case into the model is neither practical, nor particularly useful for
improving model results.
- Higher resolution data on the location of surface water features has important influence on
identifying the most significant CSAs. Land use, soils, and slope tend to be the critical drivers in
identifying CSAs. Introducing more detailed information on the location of surface water
features created important distinctions within otherwise uniform ranking classes.
- Although a simpler, GIS-based analysis showed some promise for identifying CSAs in the MBB,
results were only moderately well-correlated with the intensive SWAT analysis and application
of the specific GIS approach to other parts of the Lake Champlain Basin cannot be fully
recommended at this time as a substitute.
- The predicted effects of climate change do not appear to reorder implementation priorities.
Although the magnitude of P loading rates are predicted to increase as a result of the changing
climate, the land areas that ranked as the most significant P CSAs under current conditions did
not change with future climate scenarios. The data suggest that designing BMPs and P reduction
strategies based on an analysis of current climate conditions will target the same groups of P
CSAs that will also be the most important under future climate conditions.
Finally, it must be emphasized that the process undertaken by this project cannot, nor is it intended to, be used
as a wholesale substitute for site visits and one-to-one work between management agency staff and a
landowner. Rather, the model results can help guide agency efforts at major sub-watershed, sub-basin, and
field scales in prioritizing and implementing land treatment measures. Such targeting will improve costeffectiveness
of conservation and restoration programs by helping deploy financial and technical resources to
areas that will yield the maximum benefit to Lake Champlain.
Report Prepared by Stone Environmental Inc
EVENT:
What: Public Hearing by Vermont Agency of Agriculture
About: Petition to require "Best Management Practices" for select farms in Lake Champlain's Missisquoi Bay Basin
When: Friday, July 18 from 9:30 AM - Noon
Where: St. Albans Historical Society, 9 Church Street, St. Albans, VT