Consistent with other demographic information, the US Census has released a report indicating that Vermont trends below the US average in several key birth metrics. Vermont has been one of the slowest growing states by population in the nation and was the only state to lose population between 2011 and 2012. The Census report describes the fertility patterns of women in the United States, patterns which have changed significantly over time. The average number of children ever born has dropped from more than three children per woman in 1976 to about two children per woman in 2012. Recent years have also seen drops in adolescent childbearing and increases in non-marital births.
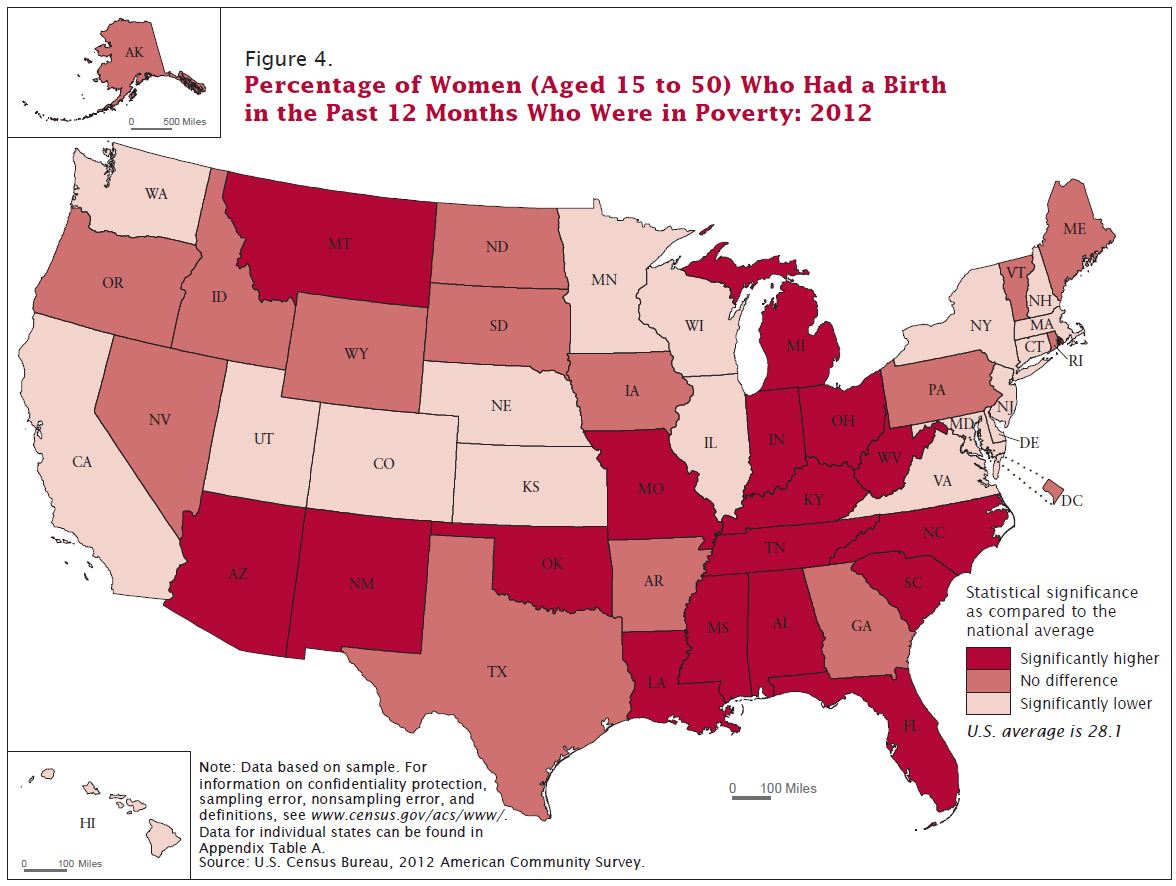
These changes in fertility are important because recent research suggests that women’s childbearing is related to their rates of employment, their educational attainment, and their economic well-being. Further-more, other research connects the circumstances into which a child is born to that child’s later outcomes, including their likelihood of living in a single-parent household and their academic achievement.
This report utilizes fertility data collected in the June 2012 Supplement to the Current Population Survey (CPS), as well as the 2012 American Community Survey (ACS), to discuss these and other trends. The report has three sections: cumulative fertility, births in the last year, and relationship status at first birth. Fertility patterns are shown by women’s race, ethnicity, age, citizenship, and employment status, as well as their state of residence.
The report also examines new topics, such as women’s marital status at the time of their first births, the completed fertility of women up to age 50, and the fertility patterns of young women.
HIGHLIGHTS
Some highlights of the report are:
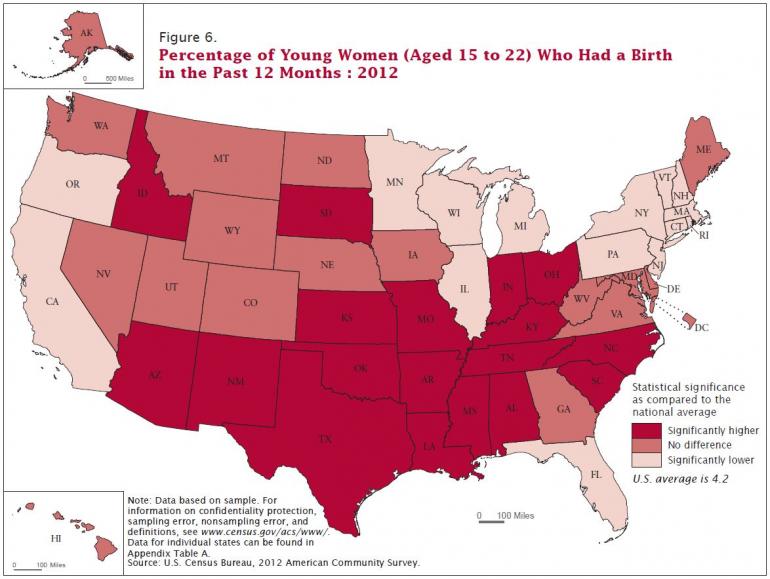
• Births to adolescents continued to decline.
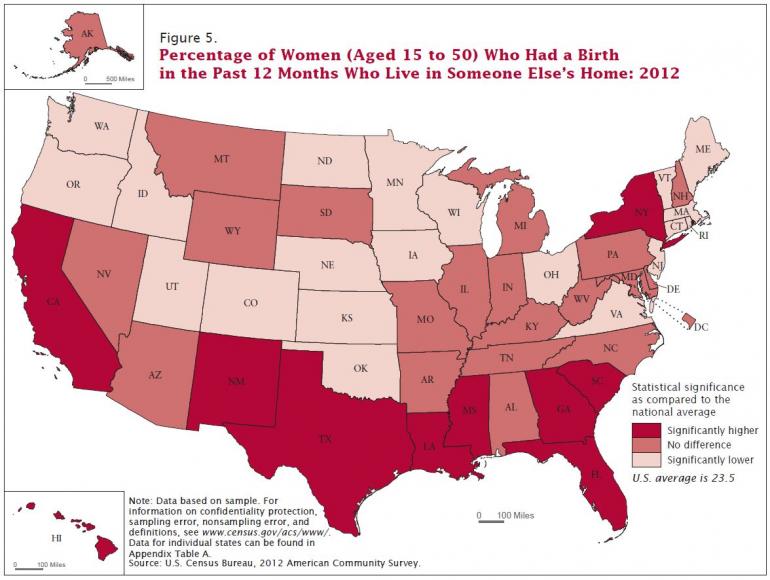
• More than one in five women with a birth in the past months reported at the time of the survey that they were living in someone else’s home.
• The majority of first births occur in marriage, as they have for decades, but the most recent cohort of young mothers is much more likely to have had their first birth in a cohabiting relationship than in marriage.
CUMULATIVE FERTILITY
 Using data from the CPS’s June 2012 interview, the Census examined the total number of children born to women aged 15 to 50 and how the number of children ever born varies between groups. In June 2012, 75.4 million women in the United States were aged 15 to 50, and 59 percent of them were mothers. Of all women aged 15 to 50, 17.2 percent had one child, 23.1 percent had two children, and 18.5 percent had three or more children.
The prevalence of both large families and childlessness (defined as not having given birth to any children) are not uniform across racial groups or by Hispanic origin. Hispanic women aged 15 to 50 have lower rates of childlessness (35.3 percent) than do women in any other group, while Asian women of the same age have the highest rates of childlessness (46.1 percent).
Forty-three percent of non-Hispanic White women and 39 percent of Black women are childless. Hispanic women aged 15 to 50 have the highest percentages of women with three or more children (25.2 percent), followed by Black women (21.3 percent).
A Decade of State Population Change
| State | Percent change 2001-02 | Percent change 2002-03 | Percent change 2003-04 | Percent change 2004-05 | Percent change 2005-06 | Percent change 2006-07 | Percent change 2007-08 | Percent change 2008-09 | Percent change 2009-10 | Percent change 2010-11 | Percent change 2011-12 |
| Alabama | 0.3 | 0.5 | 0.6 | 0.9 | 1.3 | 0.9 | 1.0 | 0.8 | 0.6 | 0.4 | 0.4 |
| Alaska | 1.4 | 0.9 | 1.7 | 1.2 | 1.3 | 0.7 | 1.1 | 1.7 | 2.2 | 1.4 | 1.0 |
| Arizona | 2.3 | 2.1 | 2.6 | 3.3 | 3.3 | 2.3 | 1.8 | 1.0 | 1.1 | 0.8 | 1.3 |
| Arkansas | 0.5 | 0.7 | 0.9 | 1.1 | 1.5 | 1.0 | 0.9 | 0.8 | 0.9 | 0.6 | 0.4 |
| California | 1.1 | 1.1 | 0.9 | 0.7 | 0.5 | 0.6 | 1.0 | 1.0 | 1.1 | 0.9 | 0.9 |
| Colorado | 1.5 | 0.9 | 1.0 | 1.2 | 1.9 | 1.8 | 1.8 | 1.7 | 1.5 | 1.3 | 1.4 |
| Connecticut | 0.8 | 0.7 | 0.3 | 0.3 | 0.3 | 0.3 | 0.5 | 0.5 | 0.4 | 0.3 | 0.1 |
| Delaware | 1.3 | 1.5 | 1.6 | 1.7 | 1.7 | 1.5 | 1.4 | 0.9 | 0.9 | 0.9 | 1.0 |
| District of Columbia | -0.2 | -0.8 | -0.1 | -0.1 | 0.6 | 0.7 | 1.0 | 2.1 | 2.1 | 2.4 | 2.1 |
| Florida | 2.0 | 1.9 | 2.4 | 2.5 | 1.8 | 1.1 | 0.9 | 0.7 | 1.0 | 1.3 | 1.2 |
| Georgia | 1.6 | 1.3 | 1.7 | 1.8 | 2.6 | 2.1 | 1.7 | 1.2 | 1.0 | 1.0 | 1.1 |
| Hawaii | 1.1 | 0.9 | 1.8 | 1.5 | 1.3 | 0.5 | 1.3 | 1.1 | 1.3 | 1.1 | 1.0 |
| Idaho | 1.5 | 1.7 | 2.1 | 2.6 | 2.8 | 2.5 | 1.9 | 1.3 | 1.1 | 0.8 | 0.8 |
| Illinois | 0.3 | 0.2 | 0.3 | 0.2 | 0.3 | 0.4 | 0.4 | 0.4 | 0.4 | 0.1 | 0.1 |
| Indiana | 0.5 | 0.7 | 0.6 | 0.7 | 0.9 | 0.7 | 0.7 | 0.5 | 0.5 | 0.4 | 0.3 |
| Iowa | 0.1 | 0.3 | 0.4 | 0.4 | 0.6 | 0.6 | 0.6 | 0.5 | 0.6 | 0.5 | 0.3 |
| Kansas | 0.4 | 0.3 | 0.4 | 0.4 | 0.6 | 0.8 | 0.9 | 0.9 | 0.9 | 0.4 | 0.5 |
| Kentucky | 0.5 | 0.7 | 0.7 | 0.9 | 0.9 | 0.9 | 0.8 | 0.6 | 0.7 | 0.5 | 0.3 |
| Louisiana | 0.4 | 0.5 | 0.7 | 0.5 | -6.0 | 1.7 | 1.4 | 1.3 | 1.2 | 0.7 | 0.6 |
| Maine | 0.8 | 0.8 | 0.5 | 0.4 | 0.4 | 0.3 | 0.3 | -0.1 | -0.2 | 0.1 | 0.0 |
| Maryland | 1.2 | 1.0 | 0.9 | 0.8 | 0.6 | 0.5 | 0.6 | 0.8 | 1.0 | 0.9 | 0.8 |
| Massachusetts | 0.3 | 0.1 | -0.2 | -0.1 | 0.1 | 0.3 | 0.6 | 0.8 | 0.6 | 0.8 | 0.6 |
| Michigan | 0.2 | 0.3 | 0.1 | 0.0 | -0.1 | -0.3 | -0.5 | -0.5 | -0.2 | 0.0 | 0.1 |
| Minnesota | 0.7 | 0.7 | 0.7 | 0.6 | 0.9 | 0.8 | 0.8 | 0.7 | 0.6 | 0.7 | 0.6 |
| Mississippi | 0.2 | 0.3 | 0.7 | 0.6 | 0.0 | 0.8 | 0.7 | 0.4 | 0.4 | 0.2 | 0.3 |
| Missouri | 0.6 | 0.6 | 0.7 | 0.7 | 0.9 | 0.8 | 0.6 | 0.6 | 0.6 | 0.2 | 0.2 |
| Montana | 0.5 | 0.9 | 1.1 | 1.1 | 1.3 | 1.3 | 1.2 | 0.8 | 0.7 | 0.7 | 0.7 |
| Nebraska | 0.5 | 0.6 | 0.6 | 0.7 | 0.6 | 0.6 | 0.7 | 0.9 | 1.0 | 0.6 | 0.7 |
| Nevada | 3.6 | 3.5 | 4.3 | 3.7 | 3.7 | 3.1 | 2.0 | 1.2 | 0.7 | 0.6 | 1.4 |
| New Hampshire | 1.1 | 0.8 | 0.8 | 0.6 | 0.8 | 0.3 | 0.3 | 0.0 | 0.0 | 0.1 | 0.2 |
| New Jersey | 0.7 | 0.6 | 0.4 | 0.2 | 0.1 | 0.2 | 0.4 | 0.5 | 0.5 | 0.4 | 0.3 |
| New Mexico | 1.3 | 1.2 | 1.4 | 1.5 | 1.5 | 1.4 | 1.0 | 1.3 | 1.4 | 0.6 | 0.3 |
| New York | 0.3 | 0.2 | 0.0 | -0.2 | -0.1 | 0.1 | 0.4 | 0.5 | 0.4 | 0.6 | 0.4 |
| North Carolina | 1.4 | 1.2 | 1.6 | 1.8 | 2.4 | 2.3 | 2.1 | 1.5 | 1.2 | 0.9 | 1.0 |
| North Dakota | -0.1 | 0.1 | 0.9 | 0.2 | 0.5 | 0.5 | 0.7 | 1.1 | 1.4 | 1.5 | 2.2 |
| Ohio | 0.2 | 0.2 | 0.2 | 0.1 | 0.2 | 0.2 | 0.1 | 0.1 | 0.1 | 0.0 | 0.0 |
| Oklahoma | 0.6 | 0.5 | 0.6 | 0.7 | 1.3 | 1.1 | 1.0 | 1.3 | 1.2 | 0.6 | 0.8 |
| Oregon | 1.3 | 1.0 | 0.6 | 1.2 | 1.6 | 1.4 | 1.2 | 1.1 | 0.8 | 0.8 | 0.8 |
| Pennsylvania | 0.3 | 0.4 | 0.3 | 0.3 | 0.5 | 0.4 | 0.4 | 0.4 | 0.3 | 0.3 | 0.2 |
| Rhode Island | 0.8 | 0.5 | 0.3 | -0.6 | -0.5 | -0.5 | -0.2 | -0.1 | -0.1 | -0.2 | 0.0 |
| South Carolina | 1.1 | 1.0 | 1.5 | 1.4 | 2.1 | 2.0 | 1.9 | 1.3 | 1.0 | 0.8 | 1.1 |
| South Dakota | 0.3 | 0.5 | 0.9 | 0.7 | 1.0 | 1.1 | 0.9 | 1.0 | 1.2 | 0.9 | 1.2 |
| Tennessee | 0.8 | 0.9 | 1.1 | 1.4 | 1.6 | 1.4 | 1.2 | 0.9 | 0.8 | 0.7 | 0.9 |
| Texas | 1.7 | 1.6 | 1.6 | 1.7 | 2.6 | 2.0 | 2.0 | 2.0 | 1.8 | 1.5 | 1.7 |
| Utah | 1.8 | 1.5 | 1.8 | 2.3 | 2.8 | 2.9 | 2.5 | 2.3 | 1.9 | 1.4 | 1.5 |
| Vermont | 0.5 | 0.4 | 0.3 | 0.2 | 0.3 | 0.1 | 0.1 | 0.1 | 0.2 | 0.1 | -0.1 |
| Virginia | 1.2 | 1.1 | 1.5 | 1.4 | 1.3 | 1.0 | 1.1 | 1.2 | 1.2 | 1.0 | 1.0 |
| Washington | 1.1 | 0.9 | 1.2 | 1.3 | 1.8 | 1.4 | 1.6 | 1.6 | 1.2 | 1.2 | 1.1 |
| West Virginia | 0.2 | 0.4 | 0.2 | 0.2 | 0.4 | 0.3 | 0.3 | 0.4 | 0.3 | 0.1 | 0.0 |
| Wisconsin | 0.7 | 0.6 | 0.6 | 0.6 | 0.6 | 0.6 | 0.5 | 0.5 | 0.4 | 0.3 | 0.3 |
| Wyoming | 1.1 | 0.7 | 1.1 | 1.0 | 1.7 | 2.3 | 2.1 | 2.5 | 0.8 | 0.5 | 1.6 |