Vermont home prices declined more rapidly than most states as home prices nationwide saw some relief over the last month, but continued to decline. Vermont prices fell 3.8 percent in January compared to a loss of 3.1 percent nationally.CoreLogic (NYSE: CLGX), a leading provider of information, analytics and business services, today released its January Home Price Index (HPI) report, the most timely and comprehensive source of home prices available today. The report shows national home prices, including distressed sales, declined on a year-over-year basis by 3.1 percent inJanuary 2012and by 1.0 percent compared toDecember 2011, the sixth consecutive monthly decline.
Excluding distressed sales, year-over-year prices declined by 0.9 percent inJanuary 2012compared toJanuary 2011, but that same metric posted a month-over-month gain, rising 0.7 percent in January. Distressed sales include short sales and real estate owned (REO) transactions.
"Although home price declines are slowly improving and not far from the bottom, home prices are down to nearly the same levels as 10 years ago," saidMark Fleming, chief economist for CoreLogic.
Highlights as ofJanuary 2012
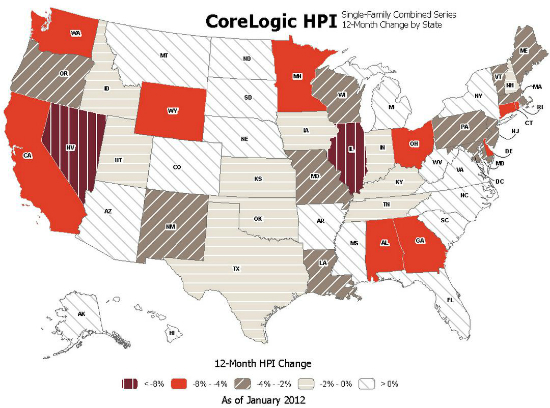
Including distressed sales, the five states with the highestappreciationwere:South Dakota(+5.7 percent),North Dakota(+4.0 percent),West Virginia(+4.0 percent),Montana(+3.6 percent) andMichigan(+3.0 percent).
Including distressed sales, the five states with the greatestdepreciationwere:Illinois(-8.7 percent),Nevada(-8.0 percent),Delaware(-7.9 percent),Alabama(-7.7 percent) andGeorgia(-7.5 percent).
Excluding distressed sales, the five states with the highestappreciationwere:South Dakota(+6.4 percent),Montana(+5.9 percent),North Dakota(+3.8 percent),Alaska(+3.7 percent) andIndiana(+2.7 percent).
Excluding distressed sales, the five states with the greatestdepreciationwere:Nevada(-6.7 percent),Delaware(-5.5 percent),Minnesota(-4.1 percent),New Jersey(-3.5 percent) andGeorgia(-3.3 percent).
Including distressed transactions, the peak-to-current change in the national HPI (fromApril 2006toJanuary 2012) was -34.0 percent. Excluding distressed transactions, the peak-to-current change in the HPI for the same period was -24.2 percent.
The five states with the largest peak-to-current declines including distressed transactions areNevada(-60.1 percent),Arizona(-50.8 percent),Florida(-49.0 percent),California(-43.6 percent) andMichigan(-43.2 percent).
Of the top 100 Core Based Statistical Areas (CBSAs) measured by population, 71 are showing year-over-year declines in January, eight fewer than in December.
*December data was revised. Revisions with public records data are standard, and to ensure accuracy, CoreLogic incorporates the newly released public data to provide updated results.
JanuaryStateand National Ranking Based on HPI Including Distressed:
January 2012 12-Month HPI
State
Change by State
Single Family
Single Family
Excluding Distressed
National
-3.1%
-0.9%
Illinois
-8.7%
-2.6%
Nevada
-8.0%
-6.7%
Delaware
-7.9%
-5.5%
Alabama
-7.7%
-2.3%
Georgia
-7.5%
-3.3%
Wyoming
-6.0%
1.0%
Ohio
-5.6%
-1.1%
Rhode Island
-5.6%
-0.8%
Minnesota
-5.1%
-4.1%
Connecticut
-4.8%
-2.8%
California
-4.8%
-0.9%
Washington
-4.8%
-1.1%
Vermont
-3.8%
-0.9%
Louisiana
-3.6%
1.6%
New Jersey
-3.3%
-3.5%
Wisconsin
-3.0%
-1.4%
Missouri
-2.8%
-2.6%
New Mexico
-2.6%
-1.5%
Maryland
-2.5%
-2.0%
Maine
-2.3%
2.2%
Pennsylvania
-2.2%
-1.2%
Oregon
-2.1%
-0.9%
Massachusetts
-2.0%
1.4%
Tennessee
-1.5%
-0.6%
Kentucky
-1.4%
-0.8%
Iowa
-1.3%
-1.0%
Kansas
-1.2%
0.9%
Oklahoma
-1.0%
0.1%
Idaho
-0.5%
-1.7%
Texas
-0.4%
1.9%
New Hampshire
-0.2%
1.7%
Utah
-0.1%
1.7%
Indiana
-0.1%
2.7%
Colorado
0.1%
1.8%
Hawaii
0.1%
0.6%
Arkansas
0.2%
-0.9%
North Carolina
0.3%
0.9%
Virginia
0.4%
1.4%
Arizona
0.6%
-1.4%
Mississippi
1.2%
-0.7%
New York
1.4%
1.5%
District of Columbia
1.6%
0.6%
Nebraska
1.7%
1.4%
Florida
1.8%
1.2%
Alaska
2.2%
3.7%
South Carolina
2.8%
1.6%
Michigan
3.0%
0.2%
Montana
3.6%
5.9%
North Dakota
4.0%
3.8%
West Virginia
4.0%
2.7%
South Dakota
5.7%
6.4%
January HPI for the Country's Largest CBSAs by Population:
January 2012 12-Month HPI
CBSA
Change by CBSA
Single Family
Single Family Excluding Distressed
Chicago-Joliet-Naperville, IL
-8.5%
-2.4%
Atlanta-Sandy Springs-Marietta, GA
-7.4%
-2.6%
Los Angeles-Long Beach-Glendale, CA
-5.0%
0.3%
Riverside-San Bernardino-Ontario, CA
-4.0%
-2.0%
Philadelphia, PA
-1.9%
0.2%
Houston-Sugar Land-Baytown, TX
-0.8%
3.6%
New York-White Plains-Wayne, NY-NJ
0.5%
1.1%
Washington-Arlington-Alexandria, DC-VA-MD-WV
0.7%
2.1%
Dallas-Plano-Irving, TX
1.0%
2.1%
Phoenix-Mesa-Glendale, AZ
2.5%
0.3%
Source: CoreLogic.
SANTA ANA, Calif.,March 7, 2012/PRNewswire/ --