By Ed Barna Vermont Business MagazineThose who believe the economic slump is moderating could cite the 2011 bankruptcy filings in support.According to figures provided by Thomas Hart, the clerk of Vermont’s federal bankruptcy court in Rutland, there were 1,127 filings last year, an improvement of nearly 31 percent from 2010’s total of 1,626. Though the current downturn is said to have begun in 2008, the full effects of the shock weren’t felt until then; 2009 totaled 1,541 filings, and 2008 had 1,208.
Those figures include both personal and business bankruptcies. Looking just at the business figures, which include those for Chapter 7 (liquidation), Chapter 11 (reorganization), Chapter 12 (family farms) and Chapter 13 (some repayment of debts), the picture is even better. Only in 2006 was that total lower.
The sums were: 33 in 2006, 64 in 2007, 48 in 2008, 60 in 2009, 67 in 2010, and 46 in 2011. The 2011 number was an improvement of a little over 31 percent.
The 2010 numbers were by no means Vermont’s high water mark for financial failures. In 2005, the total went beyond 2,000 for the first, and only, time since 1992: of the 2,616 filings, 77 were business-related. The worst year for businesses in the past decade was 2001 (dot-com bust), when there were 94.
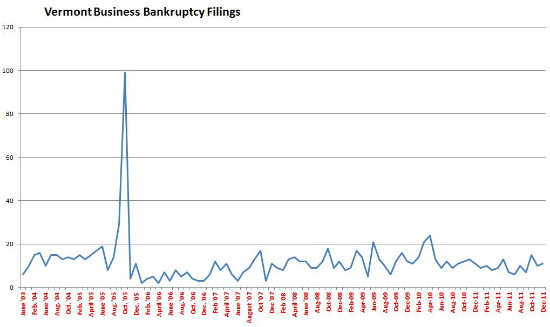
Changes in the bankruptcy code may help account for the fact that the business totals in the 1990s were much worse. They represented 218 of the 994 in 1992, 152 of the 835 in 1993, 125 of the 818 in 1994, 159 of the 1,044 in 1995, 142 of the 1,359 in 1996, and 163 of the 1,736 in 1997. Then in 1998, while bankruptcies as a whole rose to 1,867, business filings plummeted to 84, and have stayed below 100 ever since.
The 2011 figure of 46 was the second-lowest posted since the tallies began, with 2006 the best at 33. Some of that might be explained by a change in bankruptcy law in 2005, which caused a spike in filings before stricter regulations went into effect.
The business climate appears to have toughened considerably since the 1990s, as reflected in the reluctance of filers to attempt a reorganization plan under Chapter 11. From 1992 through 2000, Chapter 11s averaged 19 per year. From 2001 through 2010, the average per year was 4.2. Chapter 7 filings represent companies that simply went out of business.