The Vermont Department of Labor announced today that the seasonally-adjusted statewide unemployment rate for March 2012 was 4.8 percent, a decrease of one-tenth of a percent from the revised February rate. This is the seventh straight month reporting a decline in the seasonally-adjusted statewide unemployment rate. The comparable national unemployment rate for March 2012 was 8.2 percent; also a decline of one-tenth of a percent from the previous month.
â Vermontâ s unemployment rate had only a minor decrease this month, but in looking back even to last fall, the state has made great progress. In August of 2011, Vermontâ s seasonally-adjusted statewide unemployment rate was 5.6 percent. In just over a half-year, we are at 4.8 percent- a
Vermont Labor Force Statistics (Seasonally Adjusted)
Changes From
March
2012
February
2012
March
2011
February
2012
March
2011
Total Labor Force
359,900
360,700
359,800
-800
100
Employment
342,800
342,900
339,100
-100
3,700
Unemployment
17,100
17,800
20,700
-700
-3,600
Rate (%)
4.8
4.9
5.8
-0.1
-1.0
Vermontâ s labor force, employment and unemployment statistics are produced from a combination of a Statewide survey of households and statistical modeling. The data are produced by the Local Area Unemployment Statistics Program (LAUS) a cooperative program with the US Department of Labor, Bureau of Labor Statistics and the Vermont Department of Labor.
significantly positive improvement. While Vermont continues to face some short and long-term economic concerns, we are in a better position to address these challenges. Right now, our focus at the Department of Labor is helping every Vermonter who is seeking work find a good job here in this state,’said Department of Labor Commissioner Annie Noonan.
State of Vermont Overview
The Vermont seasonally adjusted unemployment rate decreased by one-tenth of a percent in March to 4.8 percent. The comparable rate over the same time period for the United States experienced a similar decline of one-tenth of a percent to the level of 8.2 percent. The seasonally adjusted Vermont data show the total Vermont labor force decreased by 800. Total employment decreased by 100 while total unemployment decreased by 700.
March unemployment rates for Vermontâ s 17 labor market areas ranged from 3.3 percent in Warren-Waitsfield to 9.3 percent in Newport (note: local labor market area unemployment rates are not seasonally adjusted). For comparison, the March unadjusted unemployment rate for Vermont was 5.3 percent which reflects a decrease of two-tenths of a percent from the February level and a decline of 1.1 percent from a year ago.
Analysis of Job Changes by Industry
The preliminary â not-seasonally-adjusted’jobs estimates for March show a decrease of 1,250 jobs when compared to the revised February numbers. This reported over-the-month change does not include the 150 job decrease between the preliminary and the revised February estimates due to the inclusion of more data. The broader economic trends can be detected by focusing on the changes between March 2012 and March 2011. As detailed in the preliminary â not seasonally adjusted’March data, Total Private Industries have increased by 1.7 percent (4,100 jobs) while Government has shed employment (-900 jobs or -1.6 percent) within the last year.
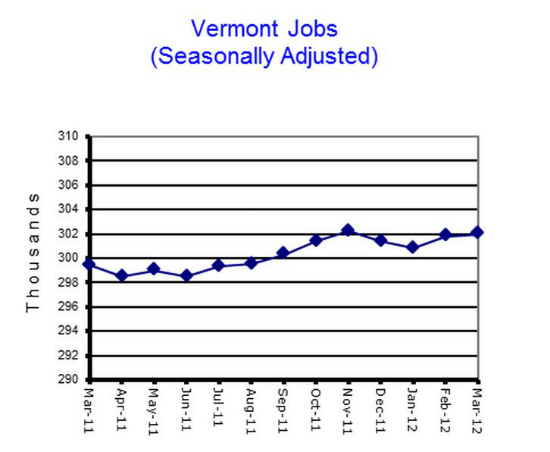
The seasonally adjusted data for March reports an increase of 200 jobs from the revised February data. As with the â not-seasonally-adjusted’data, this over-the-month change is from the revised February numbers which experienced a downward revision from the preliminary estimates by 300 jobs. A review of the seasonally adjusted March numbers reflects that Vermontâ s Private Industries reported a decrease of 200 jobs while Total Government reported an increase of 400 jobs. Leisure & Hospitality and Local Government reported the largest over the month nominal job gains ‘both adding 600 jobs. Alternatively, Trade, Transportation & Utilities and Professional & Business Services reported the largest over the month nominal declines (600 jobs and 400 jobs, respectively). A review of the over-the-year changes from March 2011 shows job gains for all industry groups except three (Wholesale Trade, Other Services, and Local Government). This broad-based advance in job gains across industries reflects improved economic conditions from the previous year.
Vermont Seasonally Adjusted Nonfarm Employment in Thousands
BY NAICS
Prelim.
Revised
Revised
Change From:
% Change From:
Mar-12
Feb-12
Mar-11
Feb-12
Mar-11
Feb-12
Mar-11
Total - Nonfarm
302.0
301.8
299.4
0.2
2.6
0.1
0.9
Private Industries
249.2
249.4
245.4
-0.2
3.8
-0.1
1.5
Construction
14.0
14.2
13.6
-0.2
0.4
-1.4
2.9
Manufacturing
31.2
31.1
30.8
0.1
0.4
0.3
1.3
Durable Goods
22.0
22.0
21.6
0.0
0.4
0.0
1.9
Non-Durable Goods
9.2
9.1
9.2
0.1
0.0
1.1
0.0
Trade, Transportation & Utilities
56.7
57.3
56.3
-0.6
0.4
-1.0
0.7
Wholesale Trade
9.4
9.5
9.5
-0.1
-0.1
-1.1
-1.1
Retail Trade
38.5
38.9
38.0
-0.4
0.5
-1.0
1.3
Trans., Warehousing & Utilities
8.8
8.9
8.8
-0.1
0.0
-1.1
0.0
Financial Activities
12.1
11.9
12.1
0.2
0.0
1.7
0.0
Finance & Insurance
9.1
9.0
9.1
0.1
0.0
1.1
0.0
Real Estate, Rental & Leasing
3.0
2.9
3.0
0.1
0.0
3.4
0.0
Professional & Business Services
26.0
26.4
24.4
-0.4
1.6
-1.5
6.6
Professional., Scientific & Technical
14.5
14.7
13.6
-0.2
0.9
-1.4
6.6
Administrative Support & Waste
9.9
9.7
9.4
0.2
0.5
2.1
5.3
Education & Health Services
60.8
60.9
59.6
-0.1
1.2
-0.2
2.0
Private Ed. Services
13.2
13.1
12.7
0.1
0.5
0.8
3.9
Health Care & Social Assistance
47.6
47.8
46.9
-0.2
0.7
-0.4
1.5
Leisure & Hospitality
33.0
32.4
32.8
0.6
0.2
1.9
0.6
Arts, Entertainment & Recreation
3.9
3.9
3.8
0.0
0.1
0.0
2.6
Accommodation & Food Services
29.1
28.5
29.0
0.6
0.1
2.1
0.3
Other Services
9.8
9.6
9.9
0.2
-0.1
2.1
-1.0
Total Government
52.8
52.4
54.0
0.4
-1.2
0.8
-2.2
State Government
17.8
17.8
17.6
0.0
0.2
0.0
1.1
Local Government
28.9
28.3
30.1
0.6
-1.2
2.1
-4.0
Burlington-S. Burlington MSA
Total - Nonfarm
114.4
113.9
113.0
0.5
1.4
0.4
1.2
Vermont Dept of Labor 4.20.2012