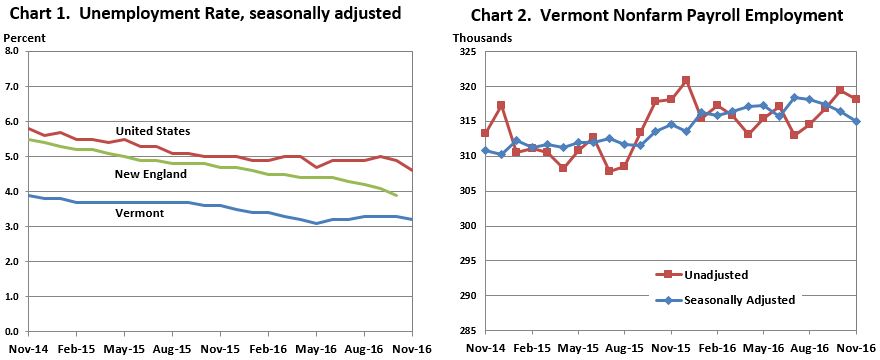
Vermont Business Magazine Even while many open jobs continue to be unfilled, the state’s unemployment rate rose one-tenth to 3.3 percent last month. The Vermont Department of Labor announced today that the seasonally-adjusted statewide unemployment rate for August was 3.3 percent. This represents an increase of one-tenth of one percentage point from the revised July rate (3.2 percent). After a historic period of not increasing, the state jobless rate has gone up twice in the last three months, by a total of two tenths. The national rate in August was 4.9 percent.
 All three of the major data points were slightly negative. The seasonally-adjusted Vermont data for August show the Vermont civilian labor force decreased by 50 from the prior month’s revised estimate. The number of employed decreased by 250 and the number of unemployed increased by 200. None of the over-the-month changes were statistically significant in the seasonally-adjusted series.
Overall, Vermont’s unemployment rate was fifth lowest in the country. New England placed four states in the top 13 (New Hampshire two at 3.0 percent; Massachusetts ten at 3.9 percent and Maine at thirteen at 4.0 percent, Connecticut and Rhode Island were tied for fortieth at 5.6 percent, SEE TABLES BELOW). As of the prior month’s initial data, the Burlington-South Burlington Metropolitan NECTA was tied for the seventh lowest unemployment rate in the country for all metropolitan areas at 2.9 percent (not-seasonally-adjusted).
“Even with this month’s small rise in the rate, the statewide unemployment rate is still low compared to historical averages. We would have to go back to 2001 to find UI rates as low as the current level, and the tight labor market conditions appear to be creating upward, positive pressure on wages, as evidenced by recently released data. In 2015, the United States posted the largest increase in median household income since record keeping began in 1967, jumping 5.2% from the prior year. Preliminary wage data in Vermont is showing a similar positive trend.
 There are many jobs available here in Vermont at all skill levels. The Vermont Department of Labor has expert staff and many resources to help connect job seekers and employers. The services are available at no cost, and offered through our 12 Career Centers. We can help with skill assessment, resume writing, interview skills, labor market information, career counseling, and job placement. For businesses, we offer a wide array of services, including, but not limited to, job posting, hiring events, resume screening, training funds, sponsored On-the-Job Training (OJT) with wage subsidies, and Apprenticeship programming. Contact your local Vermont Department of Labor Career Resource Office, or the VDOL Workforce Development Director’s Office in Montpelier, to learn about how we can help job seekers and businesses,” said Labor Commissioner Annie Noonan.
Not-Seasonally-Adjusted
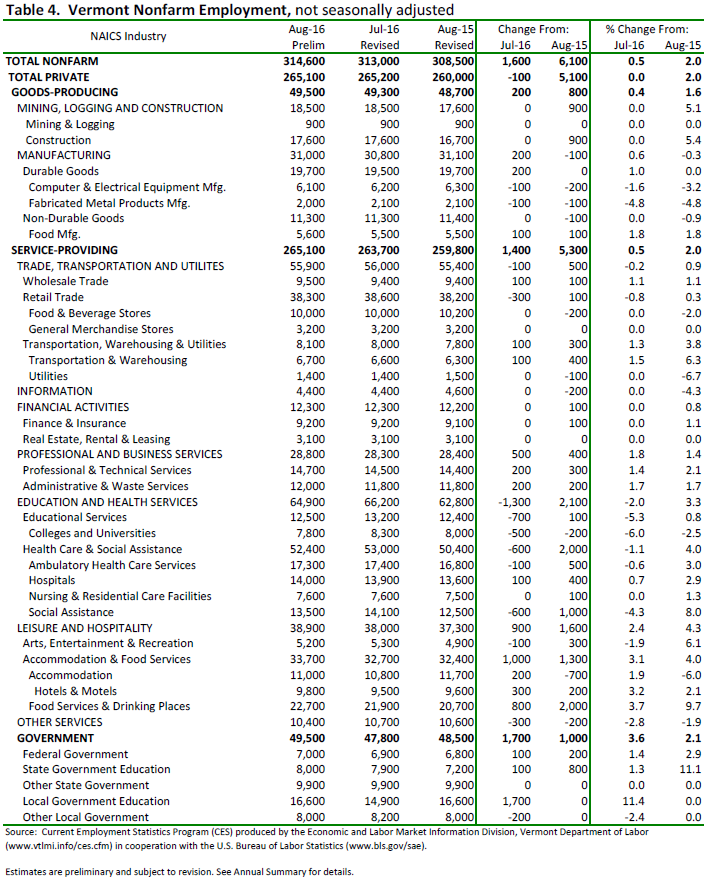
The preliminary ‘not-seasonally-adjusted’ jobs estimates for August show an increase of 1,600 jobs when compared to the revised July numbers. There was a decrease of 100 jobs between the preliminary and the revised July estimates due to the inclusion of more data. The monthly increase seen in the August numbers was attributable to the seasonal nature of Local Government Education. The broader economic trends can be detected by focusing on the over-the-year changes in this data series. As detailed in the preliminary ‘not-seasonally-adjusted’ August data, Total Private industries have increased by 5,100 jobs (2.0 percent) and Government (including public education) employment has increased by 1,000 jobs (2.1 percent) in the past year.
Seasonally-Adjusted
The seasonally-adjusted data for August reports a decrease of 300 jobs from the revised July data. As with the ‘not-seasonally-adjusted’ data, this over-the-month change is from the revised July numbers which experienced a 200 job decrease from the preliminary estimates. The seasonally-adjusted over-the-month changes in August were mixed at the sectorial level. Those with a notable percent increase include: Leisure and Hospitality (+900 jobs or +2.4%), Federal Government (+100 jobs or +1.4%) and Manufacturing (+300 jobs or +1.0%). Industries with a notable percent decrease include: Local Government (-900 jobs or -2.9%), Education and Health Services (-800 jobs or -1.2%) and Other Services (-100 jobs or -1.0%).
NOTE: Employment (nonfarm payroll) - A count of all persons who worked full- or part-time or received pay from a nonagricultural employer for any part of the pay period which included the 12th of the month. Because this count comes from a survey of employers, persons who work for two different companies would be counted twice. Therefore, nonfarm payroll employment is really a count of the number of jobs, rather than the number of persons employed. Persons may receive pay from a job if they are temporarily absent due to illness, bad weather, vacation, or labor-management dispute. This count is based on where the jobs are located, regardless of where the workers reside, and is therefore sometimes referred to as employment "by place of work." Nonfarm payroll employment data are collected and compiled based on the Current Employment Statistics (CES) survey, conducted by the Vermont Department of Labor. This count was formerly referred to as nonagricultural wage and salary employment.

| State | August 2016(p) rate |
Rank |
|---|---|---|
|
South Dakota |
2.9 | 1 |
|
New Hampshire |
3.0 | 2 |
|
North Dakota |
3.1 | 3 |
|
Nebraska |
3.2 | 4 |
|
Vermont |
3.3 | 5 |
|
Hawaii |
3.4 | 6 |
|
Utah |
3.7 | 7 |
|
Colorado |
3.8 | 8 |
|
Idaho |
3.8 | 8 |
|
Arkansas |
3.9 | 10 |
|
Massachusetts |
3.9 | 10 |
|
Virginia |
3.9 | 10 |
|
Maine |
4.0 | 13 |
|
Minnesota |
4.0 | 13 |
|
Iowa |
4.2 | 15 |
|
Wisconsin |
4.2 | 15 |
|
Delaware |
4.3 | 17 |
|
Kansas |
4.3 | 17 |
|
Maryland |
4.3 | 17 |
|
Montana |
4.3 | 17 |
|
Tennessee |
4.4 | 21 |
|
Indiana |
4.5 | 22 |
|
Michigan |
4.5 | 22 |
|
North Carolina |
4.6 | 24 |
|
Florida |
4.7 | 25 |
|
Ohio |
4.7 | 25 |
|
Texas |
4.7 | 25 |
|
New York |
4.8 | 28 |
|
Georgia |
4.9 | 29 |
|
Kentucky |
4.9 | 29 |
|
Missouri |
5.1 | 31 |
|
Oklahoma |
5.1 | 31 |
|
South Carolina |
5.1 | 31 |
|
New Jersey |
5.3 | 34 |
|
Alabama |
5.4 | 35 |
|
Oregon |
5.4 | 35 |
|
California |
5.5 | 37 |
|
Illinois |
5.5 | 37 |
|
Wyoming |
5.5 | 37 |
|
Connecticut |
5.6 | 40 |
|
Rhode Island |
5.6 | 40 |
|
Pennsylvania |
5.7 | 42 |
|
Washington |
5.7 | 42 |
|
West Virginia |
5.7 | 42 |
|
Arizona |
5.8 | 45 |
|
District of Columbia |
6.0 | 46 |
|
Mississippi |
6.0 | 46 |
|
Louisiana |
6.3 | 48 |
|
Nevada |
6.3 | 48 |
|
New Mexico |
6.6 | 50 |
|
Alaska |
6.8 | 51 |
|
Footnotes |
||
|
Note: Rates shown are a percentage of the labor force. Data refer to place of residence. Estimates for the current month are subject to revision the following month. |
||
Last Modified Date: September 20, 2016